QUARTERLY NEWSLETTER · Q2 2026
The S&P 500 Index posted its strongest quarter since 2020, rebounding sharply after a weak Q1. While high inflation, conflict in the Middle East, and hawkish central banks remained in focus, strong corporate earnings likely bolstered investor confidence, pushing the index to new all-time highs.
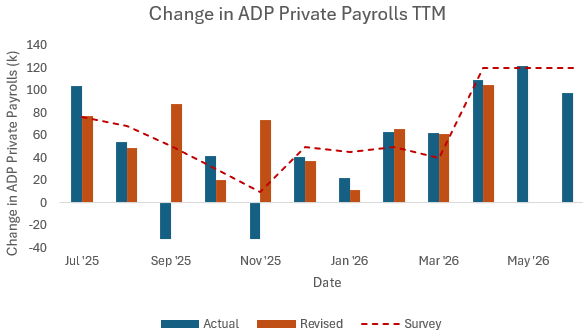
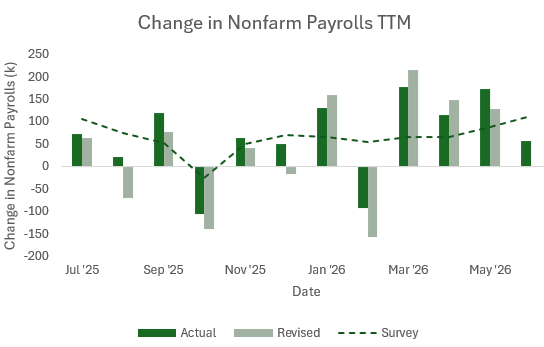
Earnings were strong across multiple sectors, with 83% of S&P 500 companies reporting over the quarter beating on earnings and 74% of those companies beating on revenue. The labor market showed resilience, with three consecutive Nonfarm Payrolls prints reflecting the addition of 465k jobs (prior to revisions), more than double analyst estimates. Businesses invested heavily in growth initiatives, particularly in Artificial intelligence (AI). Semiconductor value chains and industrials both benefited from the investment.
Encouragingly, gains were more widely spread across style, geography, and sector than they were in Q1, creating a balanced rally. Investor confidence likely improved as easing geopolitical tensions and lower energy prices (in the second half of the quarter) bolstered risk assets, pushing equity markets higher.
| Name | Q2 | YTD | 1 Year |
|---|---|---|---|
| S&P 500 | 15.2% | 10.2% | 22.3% |
| Nasdaq Composite | 21.6% | 13.1% | 29.5% |
| Dow Jones Industrial Average | 13.4% | 9.8% | 20.6% |
| Russell 1000 | 15.1% | 10.3% | 22.0% |
| Russell 1000 Growth | 16.7% | 5.3% | 17.7% |
| Russell 1000 Value | 13.9% | 16.2% | 27.1% |
| Russell 2000 | 21.6% | 22.7% | 40.9% |
| Russell 2000 Growth | 25.8% | 22.3% | 38.8% |
| Russell 2000 Value | 17.2% | 23.2% | 43.2% |
Source: Bloomberg
| Name | Q2 | YTD | 1 Year |
|---|---|---|---|
| S&P 500 Financials | 9.0% | -1.3% | 3.9% |
| S&P 500 Info Tech | 31.8% | 19.8% | 37.5% |
| S&P 500 Energy | -13.4% | 19.7% | 29.0% |
| S&P 500 Healthcare | 8.8% | 3.5% | 19.9% |
| S&P 500 Staples | 0.3% | 8.0% | 5.5% |
| S&P 500 Discretionary | 9.3% | -0.8% | 9.5% |
| S&P 500 Utilities | -0.5% | 7.7% | 14.2% |
| S&P 500 Industrials | 14.9% | 20.2% | 27.1% |
| S&P 500 Communication Services | 8.3% | 0.8% | 21.1% |
| S&P 500 Materials | 2.0% | 12.0% | 16.7% |
| S&P 500 Real Estate | 8.5% | 11.5% | 11.1% |
Source: Bloomberg
While Q1 reflected a strict bifurcation between value and growth styles, Q2 was more balanced, with U.S. growth stocks modestly outperforming value as tech rebounded and attention shifted back to artificial intelligence, technological innovation, and long-term growth trends. While technology remained a key driver, market gains were ultimately driven by a wider range of sectors.
In particular, Industrials delivered solid returns, bolstered by datacenter infrastructure spending and continued defense demand. Consumer Discretionary, Financials, Real Estate, and Healthcare all posted positive gains while Energy and Utilities declined amidst easing oil prices and rising yields.
International equities kept pace with the S&P 500 this quarter (the MSCI ACWI ex-USA Index gained 14.7%), bolstered by strong gains across Emerging Markets and Asia and easing energy prices.
| Name | Q2 | YTD | 1 Year |
|---|---|---|---|
| MSCI Emerging Markets | 24.1% | 24.0% | 44.2% |
| MSCI Europe | 12.2% | 11.3% | 22.6% |
| MSCI EAFE | 11.1% | 9.9% | 20.9% |
| MSCI Latin America | -3.4% | 10.8% | 32.4% |
| MSCI Asia | 21.5% | 21.7% | 37.8% |
Source: Bloomberg
Emerging markets were led by Taiwan (Taiwan Stock Market Index +45.98%) and South Korea (Korea Composite Stock Price Index +67.89), where strong demand for advanced semiconductors, memory chips, and artificial intelligence infrastructure supported technology shares and exports. Taiwan's export growth accelerated alongside demand for AI-related hardware, while South Korea recorded strong semiconductor exports as investment in AI increased demand for memory chips. These trends helped lift the MSCI Emerging Markets and MSCI Asia Indices by 24.1% and 21.5%, respectively.
The MSCI EAFE Index gained 11.1% during the quarter, reflecting positive returns across developed markets outside North America. Japan and Europe's largest equity markets also advanced, although returns trailed the stronger technology-driven gains across emerging Asia.
As oil prices retreated from earlier-quarter highs, lower energy costs provided relief to major importing economies, including Japan, South Korea, Taiwan, Germany, France, Italy, and Spain, by reducing transportation and production costs. Conversely, weaker crude prices created a more challenging environment for energy producers and several commodity-exporting markets, contributing to the MSCI Latin America Index's decline of 3.4%. The MSCI Europe Index also gained 12.2%, participating in the broader advance across developed international equities.
Major commodities declined as energy prices eased and domestic rate outlooks rose. Demand for traditional safe-haven assets weakened in favor of risk-on sentiment.
| Name | Q2 | YTD | 1 Year |
|---|---|---|---|
| WTI Crude Futures (Price) | -31.4% | 21.0% | 6.7% |
| Gold Spot | -14.1% | -7.2% | 21.3% |
| Silver Spot | -22.0% | -18.2% | 62.3% |
| Platinum Spot | -20.5% | -24.7% | 14.2% |
| Palladium Spot | -18.1% | -25.2% | 9.5% |
| Bitcoin Spot | -14.0% | -33.1% | -45.5% |
| Ethereum Spot | -25.3% | -47.1% | -37.1% |
| XRP Spot | -22.6% | -43.4% | -54.7% |
Source: Bloomberg
Energy prices posted some of the largest declines. WTI Crude Oil Futures fell 31.4% as fears of a prolonged Middle East supply shock eased towards the end of the quarter. Precious metals moved lower during the quarter, with Gold and Silver declining 14.1% and 22.0% against the dollar, respectively. After a strong 2025, this reflected a shift toward riskier assets, higher rate expectations, and precious metal price stabilization.
Crypto faced another challenging quarter, remaining significantly more volatile than traditional asset classes. Bitcoin fell 14.0% during the quarter and is now down nearly 33.1% year-to-date, while Ethereum and XRP declined 25.3% and 22.6%, respectively. Higher interest rates and tighter financial conditions continued to reduce investor appetite for speculative assets. At the same time, regulatory developments remained an important focus for the market as Congress continued working toward greater clarity for the cryptocurrency industry.
The GENIUS Act established a federal framework for regulating payment stablecoins, while the CLARITY Act continued to move through Congress with the goal of creating a broader regulatory framework for digital assets by defining the responsibilities of the SEC and the CFTC. Although these developments were viewed as positive steps for the industry, uncertainty around when and how future regulations will be implemented kept many institutional investors cautious, limiting broader participation in the crypto market.
Looking ahead, regulation is expected to remain an important driver of the cryptocurrency market. Continued progress toward a clearer regulatory framework could improve investor confidence, encourage greater institutional participation, and support the long-term growth of the digital asset industry. However, the timing and final scope of future legislation remain uncertain, and investors are likely to continue monitor policy developments closely.
U.S. fixed income underperformed international in Q2 on a hedged and unhedged basis. This was due in part to the repricing of Fed policy expectations, primarily concentrated in the front-end of the curve, a trend that did not occur in major European economies like Germany, France, and Italy, despite the European Central Bank (ECB) hiking rates and the Fed holding rates constant.
| Name | Q2 | YTD | 1 Year |
|---|---|---|---|
| U.S. Aggregate | 0.7% | 0.6% | 3.8% |
| U.S. Treasury | 0.3% | 0.3% | 2.7% |
| U.S. MBS | 0.6% | 1.0% | 5.2% |
| Corporate | 1.4% | 0.9% | 4.3% |
| U.S. Corporate High Yield | 2.5% | 2.0% | 5.9% |
| Municipal Bond Index | 2.5% | 2.3% | 7.0% |
Source: Bloomberg
| Name | Q2 | YTD | 1 Year |
|---|---|---|---|
| Global Aggregate | 0.9% | -0.2% | 0.6% |
| Global Treasury | 0.5% | -0.9% | -1.6% |
| Global Corporate | 1.5% | 0.2% | 2.9% |
| Global High Yield | 3.5% | 2.1% | 7.1% |
Source: Bloomberg
| Name | Q2 | YTD | 1 Year |
|---|---|---|---|
| Global Aggregate Hedged USD | 1.3% | 1.1% | 3.2% |
| Global Treasury Hedged USD | 1.1% | 0.8% | 2.0% |
| Global Corporate Hedged USD | 1.8% | 1.3% | 4.5% |
| Global High Yield Hedged USD | 3.7% | 2.8% | 8.1% |
Source: Bloomberg
Investment Grade (IG) and High Yield (HY) corporates outperformed on the quarter, with markets absorbing heightened issuance from AI infrastructure demands and risk-assets outperforming on the quarter. MBS returns were in line with the Agg as primary mortgage rates hovered around ~6.5% amidst ~4.9% 30Y yields.
Curve shape varied across regions, with U.S. yields exhibiting meaningful bear-flattening, Japanese yields bear-steepening, and major European curves bull-flattening modestly.
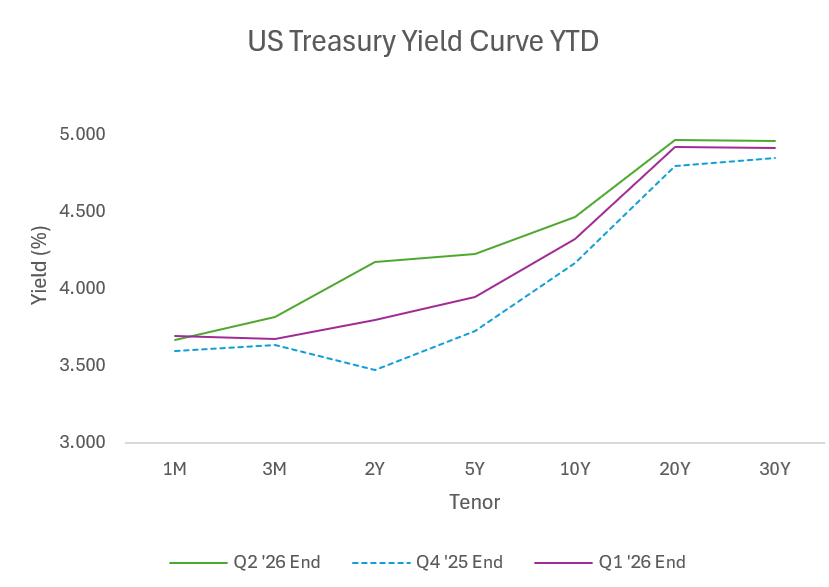
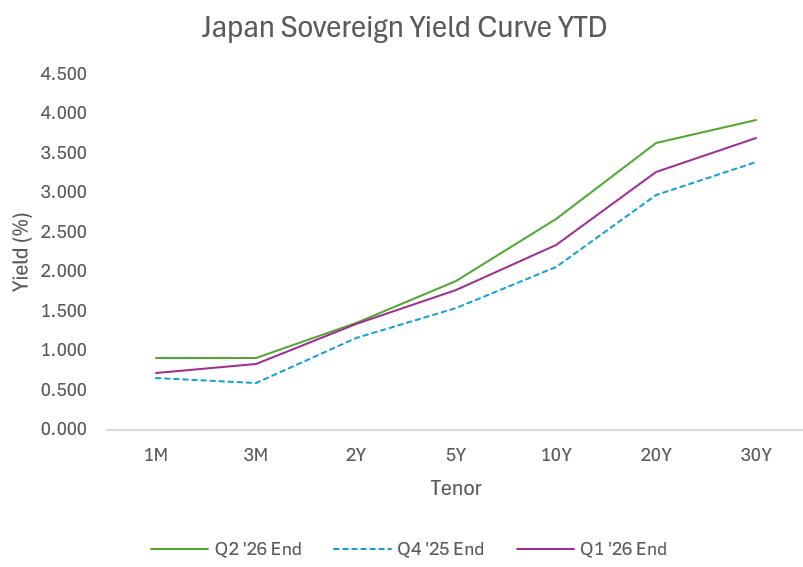
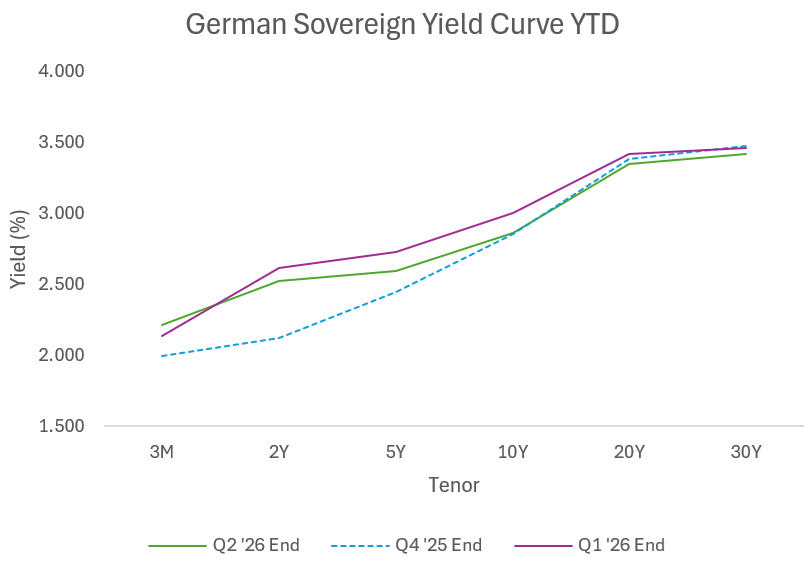
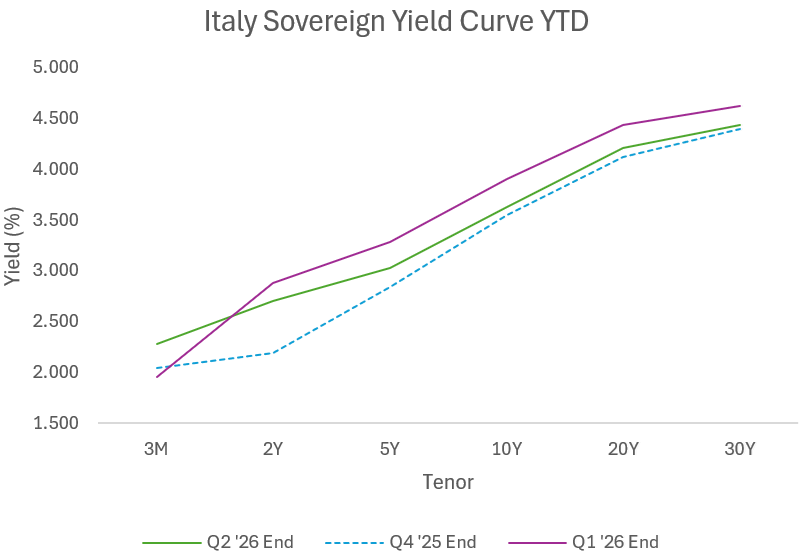
While both the Bank of Japan (BOJ) and ECB hiked rates in Q2, their curves responded quite differently. European curves bear-flattened in Q1 as investors anticipated imminent hikes, which, having been largely priced in, garnered a relatively muted reaction in Q2. Longer duration yields were well bid, particularly in the latter part of the quarter alongside easing energy prices. In the case of Japan, the BOJ’s history of easing to historically negative rates lends the central bank less long-term credibility in the success of tightening policy. Coupled with the country’s high dependence on energy imports, inflation concerns overshadowed the tightening in Q2.
In the case of the U.S., the passing of the torch from Jerome Powell to Kevin Warsh was in focus, as skeptics expressed concern that Warsh may be politically motivated to lower rates. As expressed in last quarter’s note, the trajectory of inflation and the labor market had left the Fed with little room to lower the target rate. In Q2, additional inflationary pressures stemming from elevated energy prices were added onto an already sticky Core Services rate, providing a more clearly hawkish backdrop for the Fed.
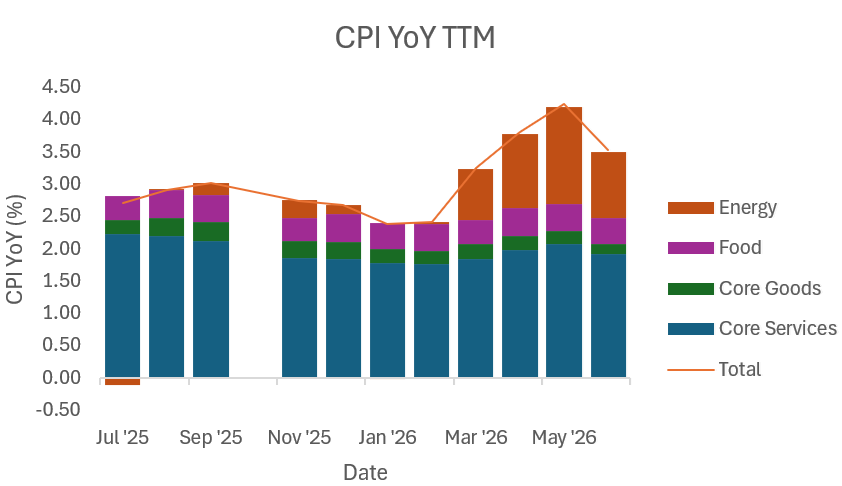
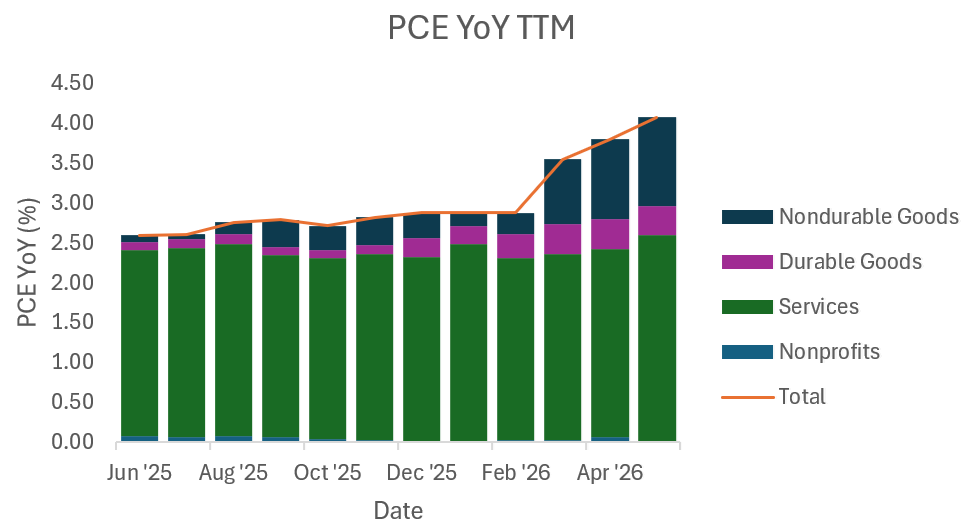
Pressure also occurred from the labor market as multiple Nonfarm Payrolls prints came in sharply higher than expected, adding to data suggesting resilience in Q1. Kevin Warsh’s debut meeting as chair of the Fed could be reasonably interpreted as hawkish, as he cited inflation as a key concern and emphasized the Fed’s continued commitment to 2% inflation. The combination of economic data and Kevin Warsh’s hawkish debut pushed front-end yields and rate policy expectations to reprice, with the Fed Funds Futures market moving from pricing in 0.29 25bp cuts in 2026 to one and a half 25bp hikes.
July 20, 2026
Certain statements made by us may be forward-looking statements and projections, which describe our strategies, goals, outlook, expectations, or projections. These statements are only predictions and involve known and unknown risks, uncertainties, and other factors that may cause actual results to differ materially from those expressed or implied by such forward-looking statements. While information is believed to be reliable, we do not guarantee its accuracy or completeness. The information contained herein represents our views as of the aforementioned date and does not represent a recommendation by us to buy or sell a security or any other financial instrument associated with it. Secure Asset Management, LLC, our clients, and our employees may buy, sell, or hold any or all of the securities mentioned. We are not obligated to provide an update if any of the figures or views presented change. Past performance is not indicative of future results. Secure Asset Management, LLC does not register as a commodities firm, and as such, advisors may not recommend commodities or cryptocurrency outside of packaged products. Indices are unmanaged and cannot be invested in directly. Returns assume dividend reinvestment unless otherwise stated. Unless otherwise specified, data is sourced from Bloomberg. Yield changes in U.S. Treasuries are derived from Bloomberg’s Mid YTM closes in the Graph Curves function, and Forward Rates are calculated using Bloomberg’s Forward Curve Analysis function. YoY refers to “Year over Year,” TTM refers to “Trailing Twelve Months,” YTD refers to “Year to Date,” and PCE refers to “Personal Consumption Expenditures.” Change in Nonfarm Payrolls revisions data may differ from previous Newsletters as revisions are released by the Bureau of Labor Statistics (BLS) twice following each month’s print and can be revised in the BLS annual benchmarking revision, which targets two years of trailing data.
At Secure Financial Group, we understand that building a successful financial practice requires not only expertise but also a solid foundation of security and trust. You see, all of our companies have been created and grown from the advisor’s perspective – we’ve done it. We have in house money managers, Attorney’s, Accountant’s, Lending and Risk Managers.
The Secure Financial Group family of companies was founded in 1997 when Secure Investors Group launched as an insurance firm devoted to bringing superior insurance products to clients. Since then, Secure Financial Group has transformed into a comprehensive financial firm, partnering with financial advisors nationwide. All told, Secure Financial Group with its affiliates, Secure Investors Group, Secure Asset Management and Aurora Securities, advise and/or manage over 4 billion in assets.


Please reach out to our team at 248-414-1590 to set up a conversation to learn more about your business and share information about us and see if it makes sense to continue the conversations in a deeper opportunity. If you prefer, use the calendar link to schedule a 15-minute introduction call.
Schedule 15-minute CallAll written consent on this site is for information purposes only. Opinions expressed herein are solely those of Secure Investors Group and our editorial staff. Material presented is to be from reliable sources; however, advisory services are offered by Secure Asset Management, L.L.C., a Registered Investment Advisor.
Insurance services offered through Secure Investors Group. Advisory services offered through Secure Asset Management, L.L.C., a Registered Investment Advisor. Tax services offered through Secure Tax Services, L.L.C. Mortgage services offered through Secure Mortgage Funding, L.L.C. Securities offered through Aurora Securities, Inc. (ASI) Member: FINRA/SIPC. The aforementioned companies are all affiliated companies and maintain common ownership. They do not offer legal advice or services.
Advisory services are offered through Secure Asset Management, LLC., a registered investment advisor. For additional detailed information about Secure Asset Management, including fees, services, and other important information, please visit www.Investor.gov/CRS or carefully read our current Client Relationship Summary (ADV Part 3) , Disclosure Brochure (ADV Part 2A), and Privacy Policy.