QUARTERLY NEWSLETTER · Q1 2026
U.S. equities began 2026 with a challenging first quarter, with the S&P 500 Index declining 4.4% (although it remains 17.8% higher on a trailing twelve-month (TTM) basis).
The weakness in equities was likely driven by a combination of macroeconomic and geopolitical factors, with the S&P 500 Index experiencing a 9.8% drawdown from its January peak before modestly rebounding to end the quarter. The decline was most pronounced in March, driven largely by escalating geopolitical tensions (particularly the conflict in Iran), which likely contributed to rising energy prices, heightened volatility, and weakness across multiple asset classes and styles.
At the start of the quarter, equities showed a divergence in style, with value outperforming growth significantly. Through February, the Russell 1000 Value Index returned 7.2% while the Russell 1000 Growth Index declined 4.8%. In March, both indices declined by around 5%. The rotation was reflective of a thematic shift toward safety amidst an unknown path toward Artificial Intelligence (AI) integration and a volatile geopolitical landscape.
| Name | Q1 | YTD | 1 Year |
|---|---|---|---|
| S&P 500 | -4.4% | -4.4% | 17.8% |
| Nasdaq Composite | -7.0% | -7.0% | 25.6% |
| Dow Jones | -3.2% | -3.2% | 12.2% |
| Russell 1000 | -4.2% | -4.2% | 17.7% |
| Russell 1000 Growth | -9.8% | -9.8% | 18.8% |
| Russell 1000 Value | 2.1% | 2.1% | 15.8% |
| Russell 2000 | 0.9% | 0.9% | 25.8% |
| Russell 2000 Growth | -2.8% | -2.8% | 23.6% |
| Russell 2000 Value | 5.0% | 5.0% | 28.2% |
Source: Bloomberg
| Name | Q1 | YTD | 1 Year |
|---|---|---|---|
| S&P 500 Financials | -9.5% | -9.5% | 0.6% |
| S&P 500 Info Tech | -9.1% | -9.1% | 29.0% |
| S&P 500 Energy | 38.2% | 38.2% | 36.3% |
| S&P 500 Healthcare | -4.9% | -4.9% | 2.3% |
| S&P 500 Staples | 7.7% | 7.7% | 6.3% |
| S&P 500 Discretionary | -9.2% | -9.2% | 11.7% |
| S&P 500 Utilities | 8.3% | 8.3% | 19.7% |
| S&P 500 Industrials | 4.6% | 4.6% | 25.0% |
| S&P 500 Communication Services | -6.9% | -6.9% | 32.5% |
| S&P 500 Materials | 9.7% | 9.7% | 18.0% |
| S&P 500 Real Estate | 2.8% | 2.8% | 2.3% |
Source: Bloomberg
Unsurprisingly, Energy was the top-performing sector during the quarter, benefiting from supply-side disruptions and a sharp increase in oil prices (S&P 500 Energy Index +38.2%). Defensive sectors also outperformed, supported by risk-off sentiment and capital rotation into lower-volatility assets (S&P 500 Utilities Index +8.3%, S&P 500 Consumer Staples Index +7.7%). On the other hand, cyclical and growth-oriented sectors lagged, with Financials (-9.5%), Consumer Discretionary (-9.2%), and Information Technology (-9.1%) among the weakest performers.
Within Technology, weakness began early in the quarter, even before the onset of geopolitical tensions. Investor sentiment shifted as concerns emerged surrounding the long-term impact of AI on labor markets and corporate profitability. This led to bifurcation within the sector: companies tied to AI infrastructure and semiconductor supply chains outperformed, while Software-as-a-Service (SaaS) and platform-based businesses faced significant pressure.
Financials also underperformed meaningfully, likely driven by concerns surrounding increased competition from AI-driven financial solutions and heightened redemption requests in private credit markets.
International equities were broadly flat during the first quarter, with notable outperformance in Latin America (MSCI Latin America Index +14.7%).
| Name | Q1 | YTD | 1 Year |
|---|---|---|---|
| MSCI Emerging Markets | -0.1% | -0.1% | 30.3% |
| MSCI Europe | -0.8% | -0.8% | 12.4% |
| MSCI EAFE | -1.1% | -1.1% | 22.0% |
| MSCI Latin America | 14.7% | 14.7% | 58.2% |
| MSCI Asia | 0.1% | 0.1% | 27.6% |
Source: Bloomberg
International equities exhibited heightened volatility throughout the quarter, with periods of relative outperformance during U.S. growth concerns, followed by sharp declines as energy prices rose. Emerging Markets largely mirrored these trends, with gains in energy-exporting regions offset by weakness in energy-importing economies.
In the second half of the quarter, global performance was heavily influenced by escalating geopolitical tensions and rising energy prices. European and Asian economies, which are heavily dependent on energy imports, faced greater economic pressure than the U.S. as oil prices surged. This was reflected in weaker equity performance in March (MSCI Europe and Asia Indices declined 7.6% and 12.9% respectively in March, while the S&P 500 Index declined 5.0% over the same period).
While international equities were generally flat in the quarter, the outperformance in Latin America can be partially attributed to its role as a commodity exporter, benefiting directly from rising energy and raw material prices. Additionally, geopolitical developments in regions such as Venezuela contributed to capital inflows and increased investor interest in the region.
Commodities delivered a strong performance in Q1 2026, with gains observed across most categories. Energy markets were the primary driver, with WTI Crude Futures surging 76.5% during the quarter. This sharp increase was largely driven by supply disruptions and reduced traffic through key global shipping routes such as the Strait of Hormuz.
Precious metals experienced modest gains during the quarter, with Gold (+8.1%) and Silver (+4.9%) both advancing. However, this performance was subdued compared to the sharp rally in precious metals in 2025. While gold continued to benefit from geopolitical uncertainty and its role as a safe-haven asset, silver’s performance was supported by both investment demand and industrial usage, particularly in sectors such as renewable energy and electronics.
Following an exceptional 2025, where precious metals saw significant appreciation, the sector experienced some consolidation in Q1 2026. Platinum and Palladium, which had previously rallied sharply due to supply constraints and strong demand, began to retrace as supply conditions improved and market imbalances normalized.
| Name | Q1 | YTD | 1 Year |
|---|---|---|---|
| WTI Crude Futures | 76.5% | 76.5% | 55.4% |
| Gold Spot | 8.1% | 8.1% | 49.4% |
| Silver Spot | 4.9% | 4.9% | 120.5% |
| Platinum Spot | -5.2% | -5.2% | 95.8% |
| Palladium Spot | -8.6% | -8.6% | 49.4% |
| Bitcoin Index | -22.5% | -22.5% | -17.9% |
| Ethereum Index | -29.5% | -29.5% | 14.4% |
| XRP Index | -26.5% | -26.5% | -36.0% |
Source: Bloomberg
Cryptocurrencies underperformed for a second consecutive quarter, failing to reliably behave like risk-on or risk-off assets. The asset class continued to exhibit high volatility, declining sharply during periods of equity market stress while occasionally acting as a modest hedge during geopolitical events.
Bitcoin declined 22.5% during the quarter, while Ethereum and XRP fell 29.5% and 26.5%, respectively. While cryptocurrencies showed resilience during the conflicts in Venezuela and Iran, they experienced high drawdowns during equity market stress in February.
An additional pressure point for cryptocurrencies has been the rising cost of energy, which directly impacts mining economics. With approximately 1 million Bitcoins remaining to be mined out of the total 21 million supply, increasing energy costs have raised the marginal cost of production.
Domestic fixed income outperformed international in Q1, accompanied by a stronger dollar (U.S Dollar Index +1.59%). Beneath the surface of the Bloomberg U.S. Aggregate Bond Index’s flat performance was strength in Mortgage-Backed Securities (MBS), driven by favorable carry overcoming convexity and duration effects. Credit underperformed on the quarter, with high-yield (HY) spreads widening 75 bps as thematic risk-off sentiment gripped financial markets amidst geopolitical and private credit concerns.
| Name | Q1 | YTD | 1 Year |
|---|---|---|---|
| U.S. Aggregate | 0.0% | 0.0% | 4.3% |
| U.S. Treasury | 0.0% | 0.0% | 3.3% |
| U.S. MBS | 0.4% | 0.4% | 5.8% |
| Corporate | -0.5% | -0.5% | 4.8% |
| U.S. Corporate High Yield | -0.5% | -0.5% | 7.0% |
| Municipal Bond Index | -0.2% | -0.2% | 4.3% |
Source: Bloomberg
| Name | Q1 | YTD | 1 Year |
|---|---|---|---|
| Global Aggregate | -1.1% | -1.1% | 4.3% |
| Global Treasury | -1.4% | -1.4% | 2.6% |
| Global Corporate | -1.3% | -1.3% | 5.9% |
| Global High Yield | -1.3% | -1.3% | 8.6% |
Source: Bloomberg
| Name | Q1 | YTD | 1 Year |
|---|---|---|---|
| Global Aggregate Hedged USD | -0.2% | -0.2% | 3.5% |
| Global Treasury Hedged USD | -0.3% | -0.3% | 2.5% |
| Global Corporate Hedged USD | -0.5% | -0.5% | 4.7% |
| Global High Yield Hedged USD | -0.9% | -0.9% | 7.8% |
Source: Bloomberg
Developed central banks were thematically hawkish in Q1, with the Federal Reserve, Bank of England, European Central Bank, Bank of Canada, and Bank of Japan all holding their target rates constant. Front-end yields rose meaningfully, with bear-flattening moves occurring in U.S., European, and Canadian yield curves (U.S., U.K., Germany, and Canada 2s10s flattened by 17 bps, 25 bps, 34 bps, and 20 bps, respectively). Japanese front-end yields rose as well (Japan 2Y +18 bps), but they were outpaced by selling pressure in longer tenors (Japan 2s10s bear-steepened 11 bps).
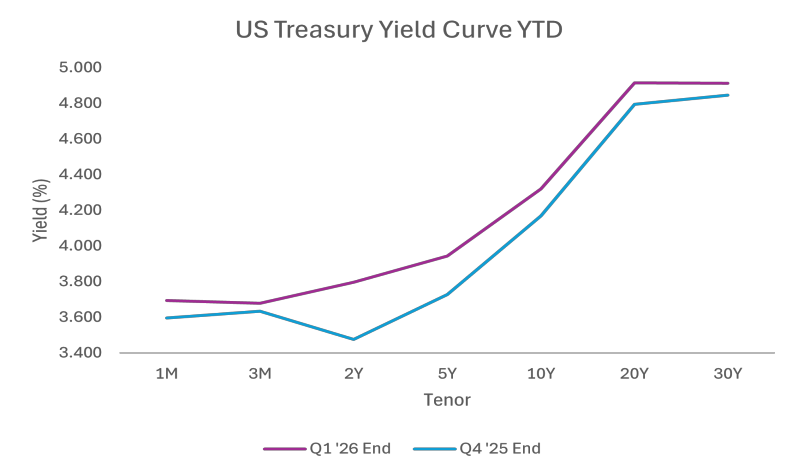
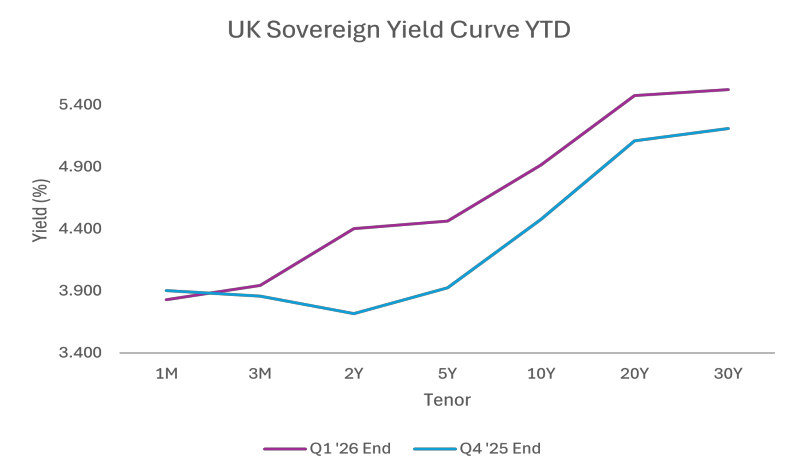
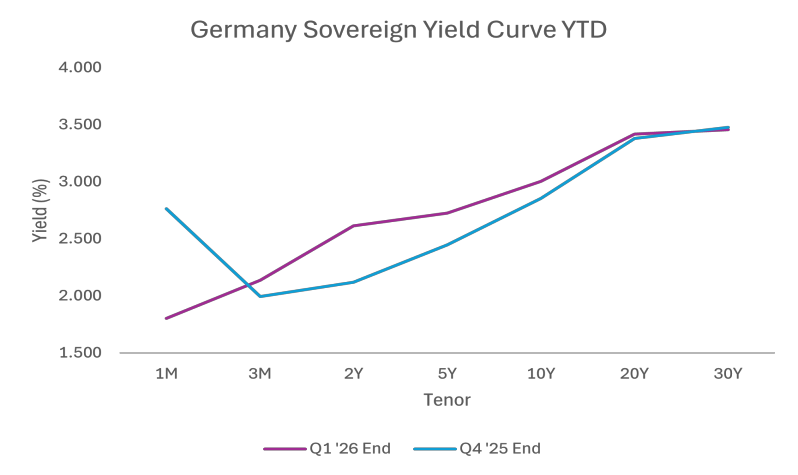
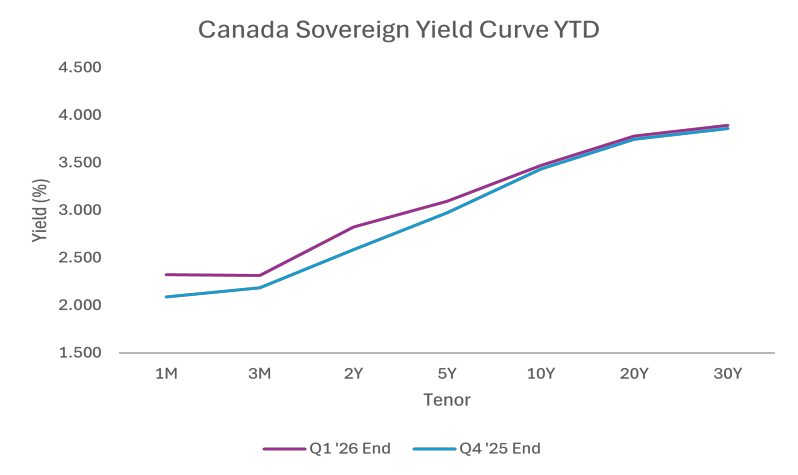
With a new Fed chair nominee (Kevin Warsh) slated to take Jerome Powell’s place this year and repeated dovish sentiment from the U.S. Federal Government, it’s notable that not only did rate-cut bets decline in Q1, but they also meaningfully repriced. At the end of 2025, over two cuts were priced in for 2026 (2.342 cuts), yet markets now imply a greater likelihood of no cuts for the year (as of the end of Q1 2026, 0.292 cuts were priced in).
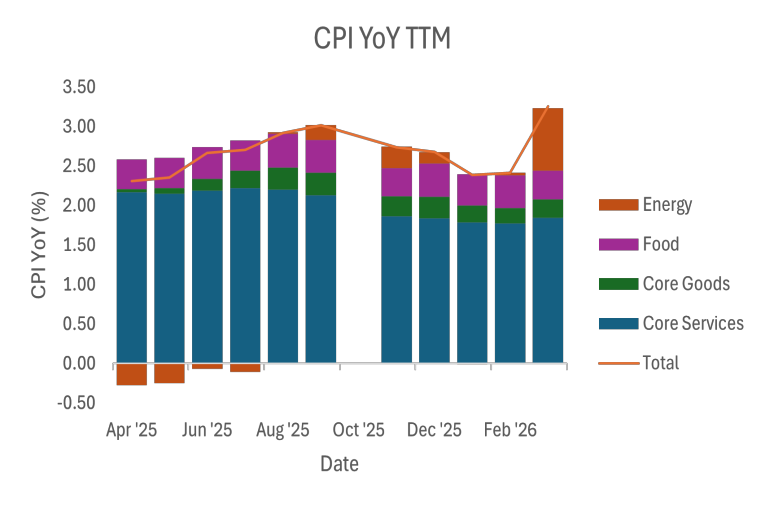
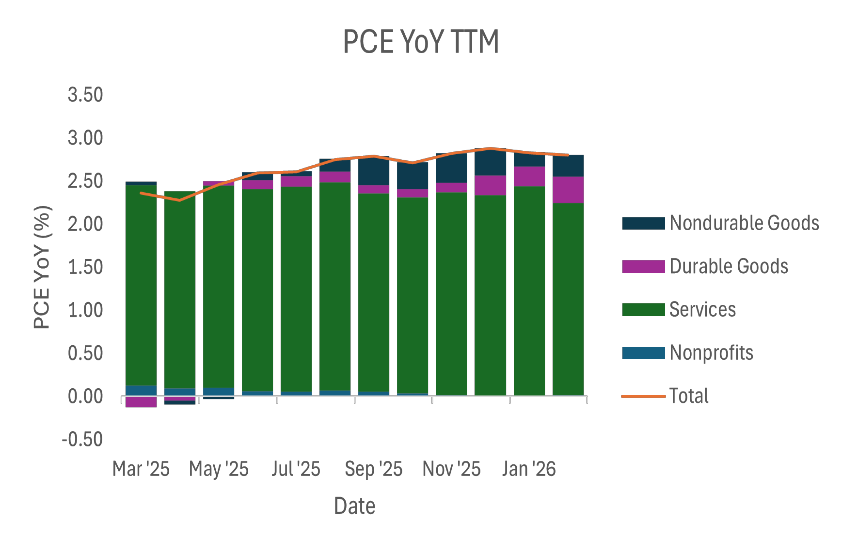
Paramount to the Fed’s decision to hold rates constant has been the balance in the labor market and inflation. In our previous note, we highlighted that inflation reflected some stability (with stickiness in Core Services), but given shutdown-related gaps in the data, the picture was not a full one. We also highlighted that the labor market had shown weakening, providing some justification for future cuts if sustained.
In Q1, the balance of labor and inflation showed signs of shifting in the other direction. Despite missing data in previous prints, the most recent Consumer Price Index (CPI) report reflected a sharp increase in prices due to rising energy costs. CPI grew by +0.9% in March vs. +0.3% the previous month, with over 80% of the headline number attributed to rising energy costs. While the print was not a surprise to analysts, it presents an obstacle to lowering the target rate in the near future if sustained.
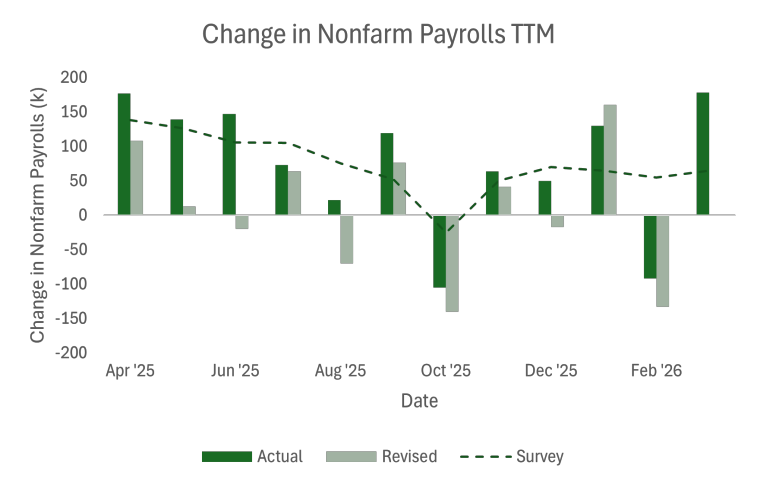
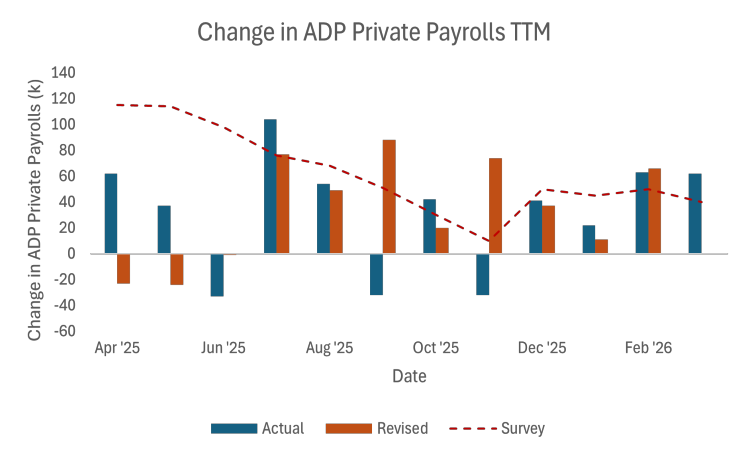
While additional data is likely needed on labor, recent prints in both public and private payrolls suggest some resilience in the labor market. Most notable was a blockbuster +178k jobs added in March vs. an expected +65k alongside two consecutive months of private job additions over +60k, exceeding analyst targets in both cases. If sustained, this would suggest limited room to lower the target rate.
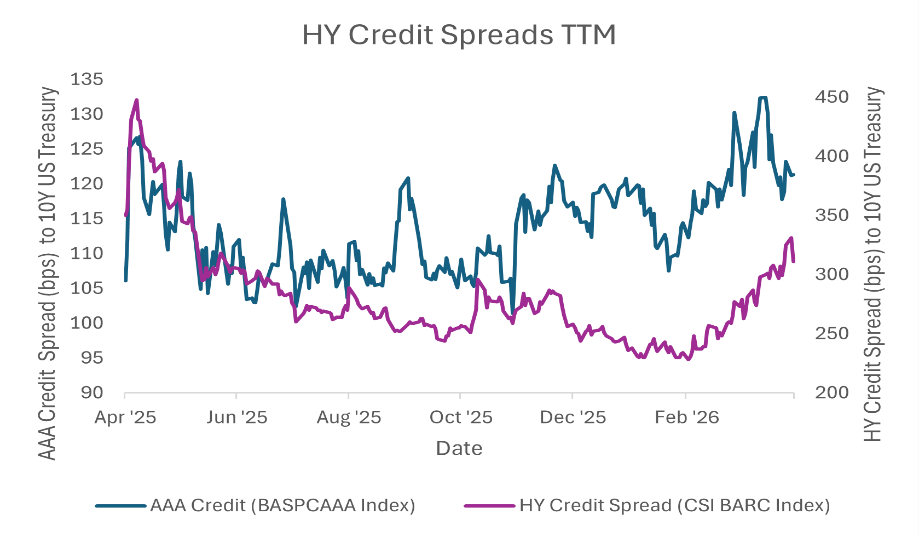
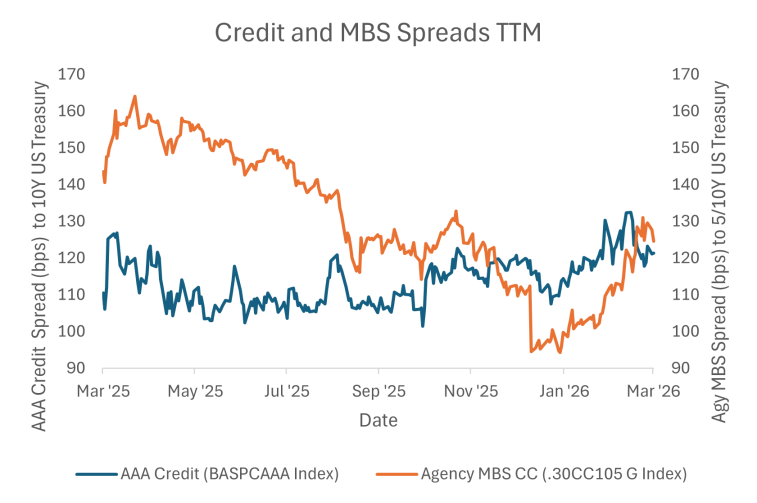
While MBS total returns exceeded credit in Q1, spreads were orderly in the investment grade (IG) space (IG AAA spreads +3 bps, MBS Current Coupon Spreads +15 bps). Lower quality credit saw greater spread widening (HY spreads +75 bps) as concerns over redemption requests in private credit funds grew throughout the quarter and geopolitical-related risk-off sentiment abounded in March.
May 11, 2026
Certain statements made by us may be forward-looking statements and projections, which describe our strategies, goals, outlook, expectations, or projections. These statements are only predictions and involve known and unknown risks, uncertainties, and other factors that may cause actual results to differ materially from those expressed or implied by such forward-looking statements. While information is believed to be reliable, we do not guarantee its accuracy or completeness. The information contained herein represents our views as of the aforementioned date and does not represent a recommendation by us to buy or sell a security or any other financial instrument associated with it. Secure Asset Management, LLC, our clients, and our employees may buy, sell, or hold any or all of the securities mentioned. We are not obligated to provide an update if any of the figures or views presented change. Past performance is not indicative of future results. Secure Asset Management, LLC does not register as a commodities firm, and as such, advisors may not recommend commodities or cryptocurrency outside of packaged products. Indices are unmanaged and cannot be invested in directly. Unless otherwise specified, data is sourced from Bloomberg. Yield changes in U.S. Treasuries are derived from Bloomberg’s Mid YTM closes in the Graph Curves function, and Forward Rates are calculated using Bloomberg’s Forward Curve Analysis function. YoY refers to “Year over Year,” TTM refers to “Trailing Twelve Months,” YTD refers to “Year to Date,” and PCE refers to “Personal Consumption Expenditures.” Change in Nonfarm Payrolls revisions data may differ from previous Newsletters as revisions are released by the Bureau of Labor Statistics (BLS) twice following each month’s print and can be revised in the BLS annual benchmarking revision, which targets two years of trailing data.
At Secure Financial Group, we understand that building a successful financial practice requires not only expertise but also a solid foundation of security and trust. You see, all of our companies have been created and grown from the advisor’s perspective – we’ve done it. We have in house money managers, Attorney’s, Accountant’s, Lending and Risk Managers.
The Secure Financial Group family of companies was founded in 1997 when Secure Investors Group launched as an insurance firm devoted to bringing superior insurance products to clients. Since then, Secure Financial Group has transformed into a comprehensive financial firm, partnering with financial advisors nationwide. All told, Secure Financial Group with its affiliates, Secure Investors Group, Secure Asset Management and Aurora Securities, advise and/or manage over 4 billion in assets.


Please reach out to our team at 248-414-1590 to set up a conversation to learn more about your business and share information about us and see if it makes sense to continue the conversations in a deeper opportunity. If you prefer, use the calendar link to schedule a 15-minute introduction call.
Schedule 15-minute CallAll written consent on this site is for information purposes only. Opinions expressed herein are solely those of Secure Investors Group and our editorial staff. Material presented is to be from reliable sources; however, advisory services are offered by Secure Asset Management, L.L.C., a Registered Investment Advisor.
Insurance services offered through Secure Investors Group. Advisory services offered through Secure Asset Management, L.L.C., a Registered Investment Advisor. Tax services offered through Secure Tax Services, L.L.C. Mortgage services offered through Secure Mortgage Funding, L.L.C. Securities offered through Aurora Securities, Inc. (ASI) Member: FINRA/SIPC. The aforementioned companies are all affiliated companies and maintain common ownership. They do not offer legal advice or services.
Advisory services are offered through Secure Asset Management, LLC., a registered investment advisor. For additional detailed information about Secure Asset Management, including fees, services, and other important information, please visit www.Investor.gov/CRS or carefully read our current Client Relationship Summary (ADV Part 3) , Disclosure Brochure (ADV Part 2A), and Privacy Policy.