
Download Secure Portfolio Fact Sheets
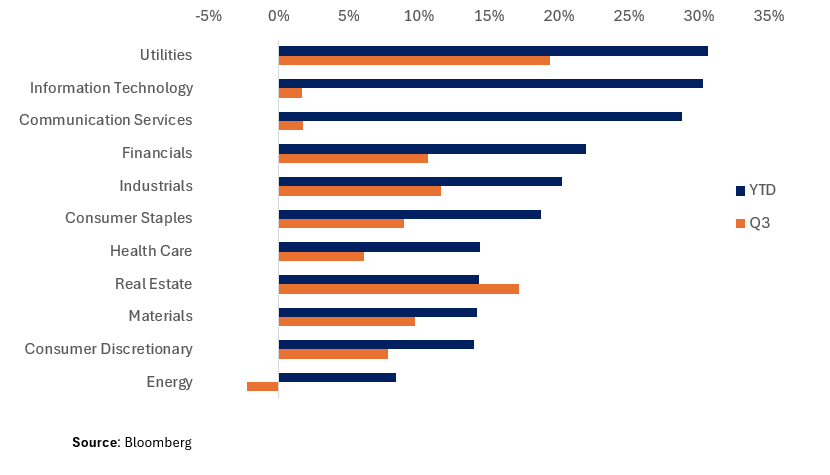
It was another quarter in the green for stocks as they continued their historic bull run, with the S&P 500 and Dow Jones Industrial Average hitting new highs in late September (S&P 500 5,767.37, Dow 42,628.32). Equity sectors saw a divergence from the year’s earlier trends that favored outperformance in Information Technology (+30.31% YTD) and Communication Services (+28.81% YTD), which are notorious for their concentration in the “Magnificent 7” stocks. Q3 performance favored defensives such as Utilities (+19.37% Q3) and Real Estate (+17.17% Q3) as well as cyclicals like Industrials (+11.55% Q3) and Materials (+9.70% Q3).
Generically, earnings in tech have been positive this cycle, albeit valuations remain stretched. NVDA for example surprised to the upside by 5.4% in its Q2 ’25 earnings, citing blockbuster revenue +15% on the quarter +122% over one year, with the CEO later citing demand for the new Blackwell chip was “insane.” Despite a positive earnings backdrop, tech valuations have become stretched over the past year, with names such as TSLA boasting triple digit P/Es and blended forward EV/EBITDA ratios well over 100% higher than peers.
Among the headwinds that lie ahead for mega-cap tech stocks are geopolitical risks. For example, NVDA recently weakened on news that China would be discouraging its companies from purchasing NVDA chips, which account for about 17% of its revenue. As we approach the end of the year, we expect to see returns continue to distribute to non-mega-cap tech as borrowing costs come down and bond yields fall, necessitating lower all-in equity yields to the same risk premium.
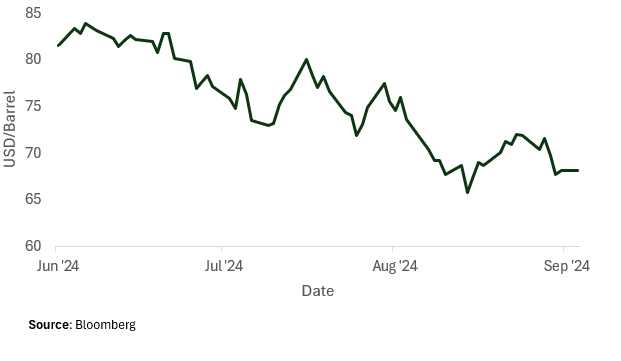
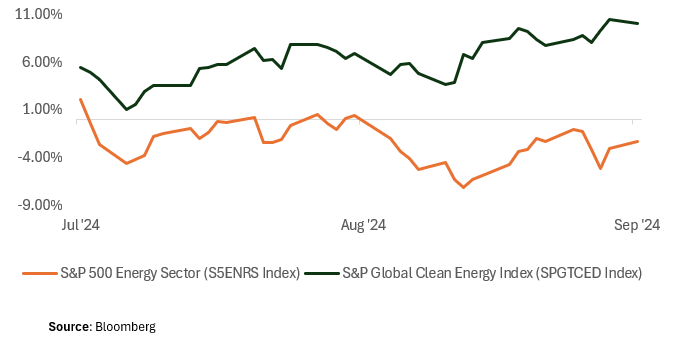
Energy underperformed in Q3 (-2.32% Q3) alongside a 16% price decline in WTI Crude oil futures, albeit a volatile one. Supply concerns contributed to the volatility, ranging from OPEC+ output hike speculation, hurricane devastation, Trump rhetoric on domestic output, and geopolitical unrest in the Middle East.
Notably, renewables outperformed during the same period (S&P Global Clean Energy Index +10.02% Q3), rallying on growing demand for clean energy in datacenters as well as positive news on the Harris campaign. Mizuho analysts estimate datacenters may consume up to 50GW of electricity by 2030 (~3x 2022 levels), potentially increasing solar energy needs by 7GW/yr through that period.
After a 525bp (5.25%) hiking cycle and over a year of no hikes or cuts, the Fed cut their target interest rate by 50bps. The decision shocked traders, who at the time were pricing a split chance of a 25 or 50bp cut. However, this Federal Reserve has been very clear and methodical in its approach: balance the scales of inflation and labor market risk, returning inflation to 2% while avoiding a recession. Leading up to their decision, data began to show softening in both inflation and labor, providing the backdrop for a cutting cycle.
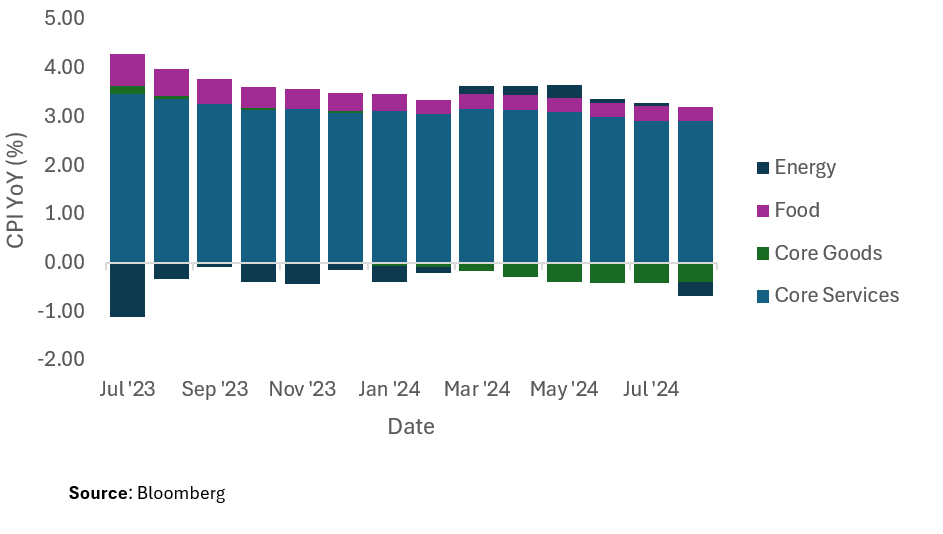
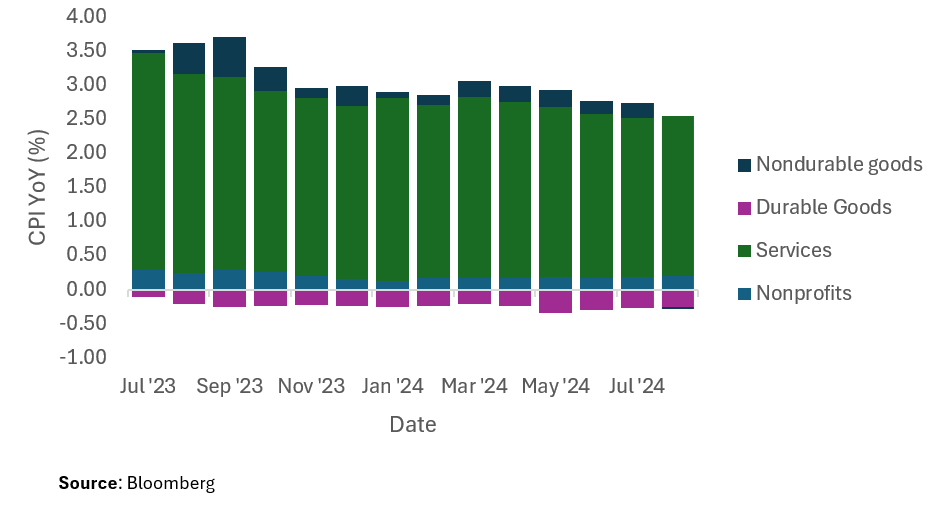
The Fed has made significant progress on its inflation objective since CPI and PCE (the Fed’s preferred measure of inflation) peaked locally in June 2022 at 9.060% and 7.249% respectively. Leading up to the September FOMC meeting, inflation was considerably closer to the Fed’s 2% target (August ‘24 CPI 2.5%, July ’24 PCE 2.5%). Notably, Services (in areas such as healthcare, transportation, housing and utilities) have been sticky in both indices, while prices in categories such as core goods and energy have been muted, at times even decreasing. The persistence of inflation in services has been a source of some concern in markets, causing investors to question if the road to 2% is as close as it appears.
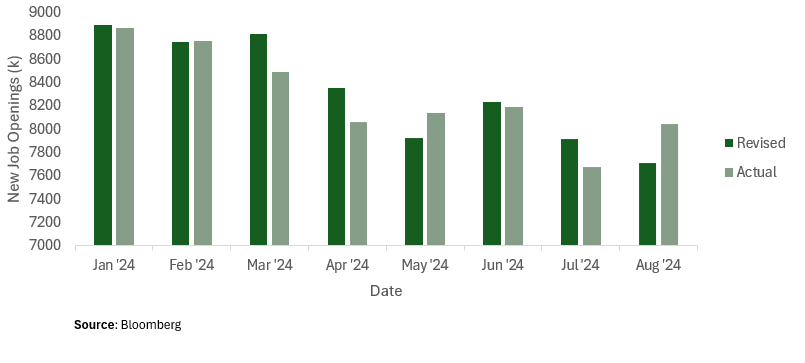
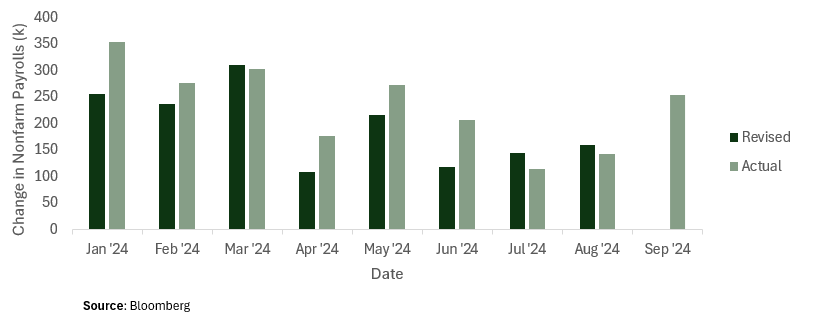
On the other end of the scale was a weakening labor market, one that investors were blind to until a weak Nonfarm Payrolls report in early August. The report cited +114k new jobs added in July vs. 175k expected and 206k the month prior. Markets were caught off guard and reacted swiftly – the 2 year closing 27bps lower on the day and Fed Funds Futures pricing in a 44.5% higher likelihood of a 50 basis point cut in September. To make matters more concerning, the Bureau of Labor Statistics revised the year’s prints through August downward by 293k, meaning the year’s previous labor data had been overstated. The weakening in the labor market wasn’t just in payrolls - new job openings (JOLTS) had been decreasing over the year, down 9.28% from the start of the year (-13.25% if using revised prints).
On the heels of the weak July jobs report, Fed chair Jerome Powell spoke at Economic Symposium in Jackson Hole, citing his confidence in the weakening of inflation and caution in the risks of the labor market, stating that while “the upside risks to inflation have diminished,” “the downside risks to employment have increased,” and “the time has come for policy to adjust.” From a Fed that had kept rates constant for a year, this was a turning point that investors could hold on to, bolstering confidence in a cut of some magnitude in the September meeting. The only question was if they should expect a 25 or 50 basis point reduction.
On September 18, the Fed shocked markets by cutting 50 basis points, albeit Powell emphasized the decision was merely a recalibration in policy and not necessarily reflective of the pace of future cuts. Stocks and bonds whipsawed following the decision, with the SP500 moving as high as ~+1% and ultimately closing in the red -0.29% on the day. Front end yields initially fell roughly 5bps, only to reverse and close at higher yields on the day (2Y closed 1.4bps higher).
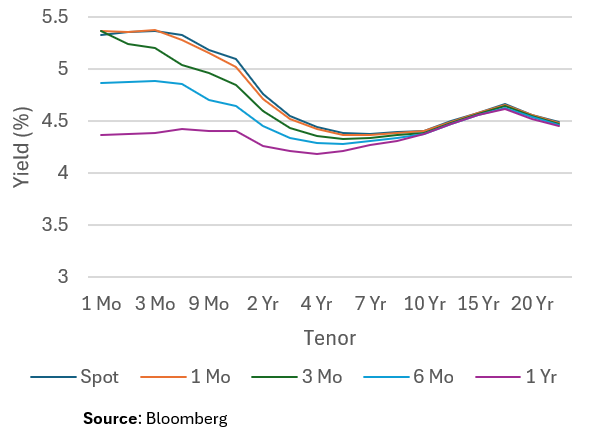
While there was elevated rate volatility on the day of the Fed decision, markets were active in the period leading up to it. From July 27, 2023 to September 17, 2024 the Fed held its target rate constant, yet the yield on the 2Y fell 133bps. The market was sharply monitoring inflation and labor data to get a pulse on the economy, factoring it into its expectations of future rates. While it’s easy to justify rate moves in retrospect, we can monitor the markets expectations of future rates in real time using the Forward Curve and the Fed Funds Futures market.
At the start of the quarter, one year forward rates were anticipating cuts, trading 50bps below the 2Y spot and 17bps below the 5Y spot. Realized 2Y and 5Y yields fell 111bps and 82bps respectively in Q3. Moreover, Fed Funds Futures priced a split probably of a 25 / 50bp cut throughout the quarter and immediately leading up to the decision (-1.658 cuts priced in at 9/17 close). These dislocations in forward / realized rates are reflective of changing information, such as the staggered timing of inflation and labor data that informed the Fed pivot in policy.
As rates come down, investors will be looking for alternative ways to capture the high fixed income yields we saw over the past year. Roughly $6.5 trillion in money manager assets are deployed to money market funds, capital that over time will need to find a new home as investors become sensitive to lower money market yields.
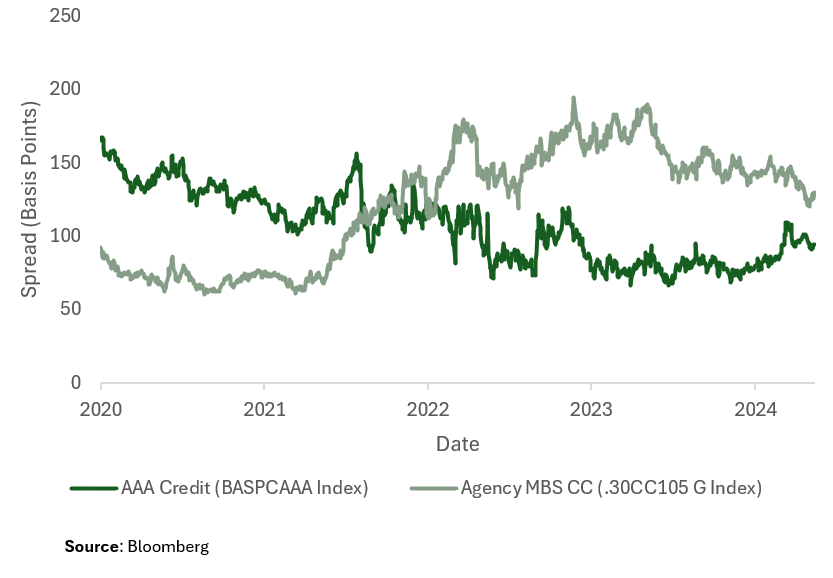
This is where high quality spread products come into play (products that pay a spread to US Treasury yields). Among spread products, two of the most popular are Investment Grade Corporate Bonds (IG Credit) and Agency Mortgage-Backed Securities (Agency MBS).
Over the past four years, we’ve observed opposite trends in the spreads of these assets. IG credit has been tightening, and Agency MBS has been widening. As of quarter end, credit spreads are roughly 12% lower than their four-year average, and Agency MBS are roughly 6% higher. As risk-free yields come down, we see a case for credit spreads to widen to low triple digits (near their four-year average). In MBS, potential money manager rotation away from money market funds and the possibility for lower future mortgage rates provide a technical backdrop for spread compression.
At Q3 end, we started to see shifts in equity and fixed income markets. In equities, the blockbuster returns of the Magnificent 7 no longer carried the S&P 500, while the defensive and cyclical sectors that had seen less gains over the past year outperformed. We’ll be watching this closely in Q4, evaluating how the earnings, geopolitical, and election backdrop influence valuations of the Mag 7 vs. other sectors. In fixed income, the Fed remains in focus. We have already seen curve steepening in Q4 – driven primarily by a selloff in the long-end of the curve. Q4 economic data has been a mixed bag – with September CPI and Nonfarm Payrolls coming in higher than expected (CPI 2.4% vs. +2.3% consensus, +2.5% prior ; NFP +254k vs. +150k consensus, +142k prior), and prints like retail sales showing a resilient consumer (September +0.4% MoM vs. +0.3% consensus, +0.1% prior). This has caused the Fed Funds Futures market to price fewer than one 25bp cut for the November FOMC meeting (0.92 cuts priced in as of 10/22). In spread products, the start of Q4 has seen further tightening in AAA credit spreads and widening in Agency MBS products. We’ll be watching both spreads for potential reversals over the quarter. In the international landscape – the technology stand-off between the US and China is evolving and has the potential to adversely impact the semiconductor industry. In oil, we’re monitoring how global supply drivers such as the conflict in the middle east and prospect of heightened domestic output could impact the commodity price. Time will tell how these trends evolve into Q4.
Disclaimer
The content in this note is for informational purposes only and is not a recommendation to purchase securities or investment advice. Unless otherwise specified, the data in this note is sourced from Bloomberg. We do not represent that the information in this note is correct, complete, or accurate. This note reflects the views of Secure Asset Management, LLC on the date it was written and may change without notice. Unless otherwise stated, performance numbers are total return and assume dividend reinvestment. Unless otherwise stated, Q3 is the period starting 06/28/2024 and ending 09/30/2024, YTD from the period starting 12/29/2023 ending 09/30/2024. Unless otherwise stated, competitors for multiples relative value analysis are selected using Bloomberg’s default “BICS Best Fit (Algo)” competitors list, and the cohort multiple to which a discount / premium is calculated using a simple average. Unless otherwise stated, “Q3 end” refers to September 30, 2024. Unless otherwise specified, yield changes in US treasuries are derived from Bloomberg’s Mid YTM closes in the Graph Curves function, and forward rates are calculated using Bloomberg’s Forward Curve Analysis function.
At Secure Financial Group, we understand that building a successful financial practice requires not only expertise but also a solid foundation of security and trust. You see, all of our companies have been created and grown from the advisor’s perspective – we’ve done it. We have in house money managers, Attorney’s, Accountant’s, Lending and Risk Managers.
The Secure Financial Group family of companies was founded in 1997 when Secure Investors Group launched as an insurance firm devoted to bringing superior insurance products to clients. Since then, Secure Financial Group has transformed into a comprehensive financial firm, partnering with financial advisors nationwide. All told, Secure Financial Group with its affiliates, Secure Investors Group, Secure Asset Management and Aurora Securities, advise and/or manage over 4 billion in assets.

Please reach out to our team at 248-414-1590 to set up a conversation to learn more about your business and share information about us and see if it makes sense to continue the conversations in a deeper opportunity. If you prefer, use the calendar link to schedule a 15-minute introduction call.
Schedule 15-minute CallAll written consent on this site is for information purposes only. Opinions expressed herein are solely those of Secure Investors Group and our editorial staff. Material presented is to be from reliable sources; however, advisory services are offered by Secure Asset Management, L.L.C., a Registered Investment Advisor.
Insurance services offered through Secure Investors Group. Advisory services offered through Secure Asset Management, L.L.C., a Registered Investment Advisor. Tax services offered through Secure Tax Services, L.L.C. Mortgage services offered through Secure Mortgage Funding, L.L.C. Securities offered through Aurora Securities, Inc. (ASI) Member: FINRA/SIPC. The aforementioned companies are all affiliated companies and maintain common ownership. They do not offer legal advice or services.
Advisory services are offered through Secure Asset Management, LLC., a registered investment advisor. For more information about Secure Asset Management, please visit at www.Investor.gov/CRS or click here to view the Firm's Form CRS.