QUARTERLY NEWSLETTER · Q3 2026
U.S. equities posted modest gains in Q3, although returns varied meaningfully across style and market cap. The S&P 500 Index advanced +2.3%, bringing its year-to-date return to +12.7%, while the Nasdaq Composite Index gained +2.6%. Strong corporate earnings and investment in artificial intelligence (AI) likely supported bullish sentiment despite developing headwinds to the AI trade, ongoing conflict in the Middle East, and higher rates.
Thematically, value outperformed growth, but returns were far less bifurcated than in Q1 (Russell 1000 Value Index +2.6%, Russell 1000 Growth Index +0.9%). While growth gained some ground in Q2, the broader year-to-date trend has favored value. Large cap stocks outperformed small caps sharply on the quarter, with the Russell 1000 Index advancing +1.8% and Russell 2000 Index declining -7.2%, likely on the heels of higher rates. Year-to-date, small caps have modestly outperformed, driven by sharp outperformance in Q2.
| Name | Q3 | YTD | 1 Year |
|---|---|---|---|
| S&P 500 | 2.3% | 12.7% | 15.7% |
| Nasdaq Composite | 2.6% | 16.1% | 19.3% |
| Dow Jones Industrial Average | -2.3% | 7.2% | 11.5% |
| Russell 1000 | 1.8% | 12.3% | 15.0% |
| Russell 1000 Growth | 0.9% | 6.3% | 7.5% |
| Russell 1000 Value | 2.6% | 19.2% | 23.8% |
| Russell 2000 | -7.2% | 13.9% | 16.4% |
| Russell 2000 Growth | -9.4% | 10.8% | 12.1% |
| Russell 2000 Value | -4.8% | 17.2% | 21.0% |
Source: Bloomberg
Corporate fundamentals remained constructive amidst a volatile macroeconomic and geopolitical landscape. 88% of companies in the S&P 500 reporting over Q3 beat earnings estimates, with 71% beating on revenue. In addition to topline performance, spending plans, cashflow generation and ability to meet future growth expectations were in focus. In particular, investors watched companies in the AI value chain for signs of return on investment, margin sustainability, and the ability to meet the massive expectations implied by their valuations.
Microsoft and Palantir posted double-digit earnings beats and rallied 16% and 29% respectively following the announcements, with Palantir’s CEO referring to their revenue as “otherworldly.” Manufacturing companies like Lam Research, Nvidia, and Micron also beat the street’s lofty expectations, with beats in earnings, revenue, gross margins, and raised guidance underpinning the strong fundamentals tied to the AI value chain.
Several thematic headwinds have emerged for the AI trade, however. In Q1, a report published by Citrini Research warning of “Ghost GDP” sent Software as a Service (SaaS) companies into a spiral, bifurcating winners and losers in the tech space.
In Q3, new headwinds to the AI trade have emerged. Over the course of the quarter, several municipalities have pushed back on datacenter expansion, leading to delays in projects that could impact revenue across multiple industries. Notably, Project Jupiter, a New Mexico datacenter funded by Oracle is facing energy bottlenecks as a key pipeline was rerouted, leading to potential delays in construction.
| Name | Q3 | YTD | 1 Year |
|---|---|---|---|
| S&P 500 Financials | -0.1% | -1.4% | 0.5% |
| S&P 500 Info Tech | 7.2% | 28.4% | 30.2% |
| S&P 500 Energy | 17.2% | 40.3% | 42.4% |
| S&P 500 Healthcare | 6.5% | 10.2% | 23.0% |
| S&P 500 Staples | -1.9% | 6.0% | 6.0% |
| S&P 500 Discretionary | -5.1% | -5.8% | -5.2% |
| S&P 500 Utilities | -12.4% | -5.7% | -7.0% |
| S&P 500 Industrials | -9.7% | 8.5% | 9.5% |
| S&P 500 Communication Services | 3.6% | 4.5% | 12.1% |
| S&P 500 Materials | -2.8% | 8.8% | 10.0% |
| S&P 500 Real Estate | -5.6% | 5.3% | 2.3% |
Source: Bloomberg
Concerns over the potential threats AI poses to society has gained momentum in Q3. These concerns gained traction after a young Anthropic researcher resigned and publicly voiced his reservations about the technology. Reports of AI agents gaining unauthorized access to institutional and corporate systems have also emerged, including a July incident in which OpenAI's models compromised parts of Hugging Face's infrastructure. Executives across the industry have acknowledged the risks associated with unconstrained AI development and have increasingly called for regulation. In the absence of a coordinated government or international framework, however, companies are beginning to impose their own guardrails. International competition to develop the technology remains a key obstacle to broader regulatory coordination. It remains unclear whether these company-led safeguards will meaningfully mitigate the risks of AI development or what their impact will be on growth and profitability. This is a theme we are monitoring closely heading into Q4, particularly for its implications on corporate earnings.
Sector performance was sharply divided, with Energy outperforming as higher oil prices bolstered returns. Industrials mean reverted after a strong Q2, facing new headwinds such as higher interest rates and delays in electrical construction projects. Health Care and Communication Services advanced meaningfully, while Utilities, Industrials, Real Estate and Consumer Discretionary lagged the index. Weakness in Utilities and Real Estate was consistent with upward pressure on yields.
Although key AI players posted strong earnings and continue to sport strong corporate fundamentals, value outperformed in Q3 as investors balanced technology opportunities with developing headwinds to the AI trade alongside higher energy prices and interest rates.
International equity returns were mixed in Q3, with most broad regional indices underperforming the S&P 500.
| Name | Q3 | YTD | 1 Year |
|---|---|---|---|
| MSCI Emerging Markets | -0.4% | 23.5% | 29.5% |
| MSCI Europe | -0.9% | 10.3% | 17.2% |
| MSCI EAFE | 0.9% | 10.9% | 16.4% |
| MSCI Latin America | 4.0% | 15.3% | 24.9% |
| MSCI Asia | 1.7% | 23.7% | 28.1% |
Source: Bloomberg
Latin America posted a strong quarter while Europe declined amidst rising energy prices. Asian markets also faced higher energy costs, although demand for AI related chips provided support for equities.
Renewed strength in energy prices created a challenging backdrop for energy importing economies in Europe and Asia. Higher fuel costs can pressure corporate margins by increasing manufacturing and transportation expenses that companies may not fully pass on to customers and reduce household spending on other goods and services. The European Central Bank's September rate increase added to the policy headwinds facing the region. European equities ended the quarter modestly lower, (-0.9%), although the Index has returned 10.3% year-to-date.
Asian technology shares were sensitive to shifts in the AI outlook. Korean memory chip stocks, including Samsung Electronics and SK Hynix, experienced a sharp decline in July, followed by a modest rebound and stabilization in August and September as sentiment improved. Earnings from Taiwan Semiconductor Manufacturing Company also reflected strong demand, with its July announcement showing second-quarter revenue of over $40 billion, up over 32% from the prior year.
Persistently high energy costs may continue to pressure profits in energy importing countries while providing tailwinds in energy exporting countries. We’ll be monitoring this theme in the quarter ahead.
Precious metals and energy were thematically higher in Q3, with energy returns almost completely reversing Q2’s decline. Escalations in the Middle East likely drove energy prices higher as renewed strikes between the U.S. and Iran called prospects for a lasting ceasefire and de-escalation into question. Oil reached over 100/bbl in early September, with prices remaining in the $100/bbl area following a drone attack on a key Saudi Arabian pipeline before ultimately declining to $90.42/bbl to end the month.
Gold whipsawed as rate expectations evolved, in part on the heels of surprises in economic data. While gold can sometimes be a hedge to geopolitical risk, it has done little to alleviate exposure to the conflict in Iran as escalations in that conflict have been a lever for energy prices, and therefore interest rates.
| Name | Q3 | YTD | 1 Year |
|---|---|---|---|
| WTI Crude Futures (Price) | 30.1% | 57.5% | 45.0% |
| Gold Spot | 3.7% | -3.7% | 7.7% |
| Silver Spot | 3.1% | -15.7% | 29.5% |
| Platinum Spot | 10.5% | -16.7% | 8.9% |
| Palladium Spot | -0.3% | -25.4% | -4.2% |
| Bitcoin Spot | 42.6% | -4.6% | -27.1% |
| Ethereum Spot | 70.4% | -10.0% | -36.1% |
| XRP Spot | 43.3% | -18.9% | -48.1% |
Source: Bloomberg
Major cryptocurrencies rebounded sharply during the quarter. Bitcoin notably advanced from August to September, moving from $62,605.65 on August 1 to a peak at $86,979.51 on September 21 as domestic equities and fixed income declined and capital moved toward scarce assets such as gold and bitcoin.
Regulatory developments remained in focus during Q3 as the CLARITY Act, intended to establish a clearer framework for digital assets, failed to advance in the Senate on September 15. Despite the strong quarterly rebound, cryptocurrencies are lower year-to-date, with Q3 gains recovering a substantial portion of earlier losses.
Geopolitical uncertainty, inflationary pressure, and the path of domestic rates remain in focus as we approach year-end.
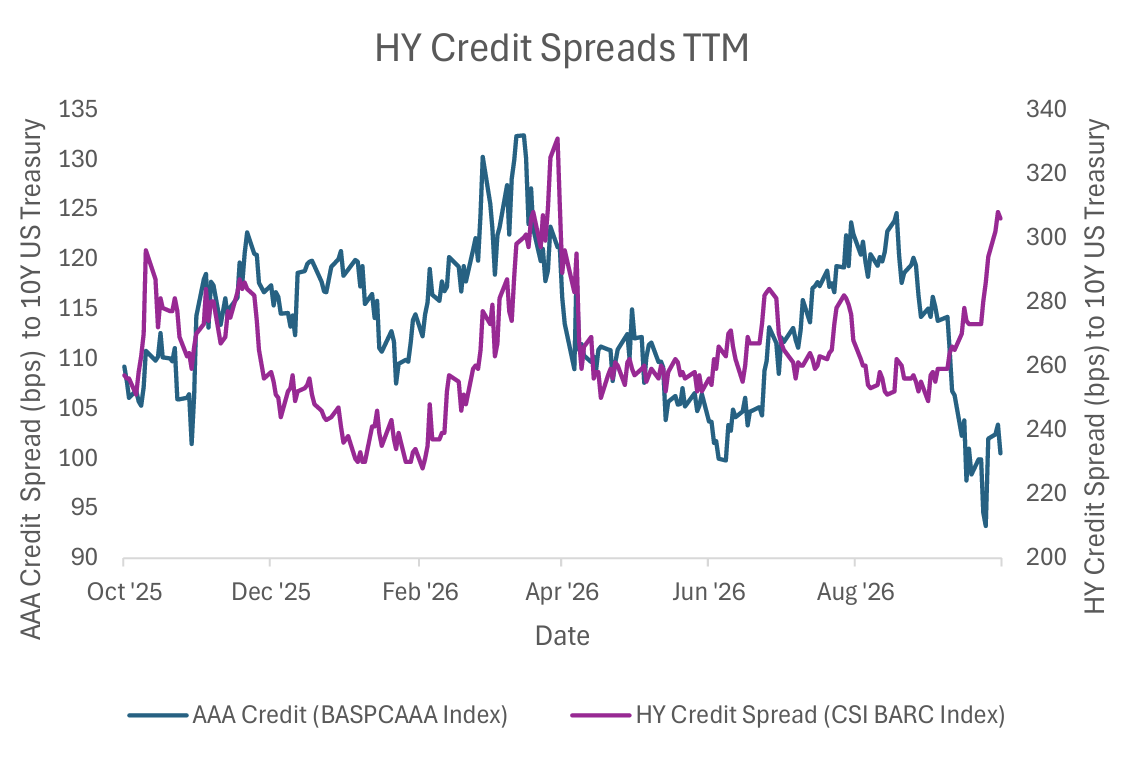
Global fixed income sold off meaningfully in Q3, with callable higher duration assets such as municipal bonds and mortgage-backed securities leading the decline amidst surging energy prices and hawkishness from global central banks. On a total return basis, high yield bonds outperformed, although spreads widened materially in September against both treasuries and AAA investment grade (IG) bonds.
| Name | Q3 | YTD | 1 Year |
|---|---|---|---|
| U.S. Aggregate | -3.5% | -2.9% | -1.8% |
| U.S. Treasury | -3.0% | -2.8% | -1.9% |
| U.S. MBS | -4.3% | -3.3% | -1.7% |
| Corporate | -3.9% | -3.1% | -2.3% |
| U.S. Corporate High Yield | -1.8% | 0.1% | 1.4% |
| Municipal Bond Index | -6.3% | -4.2% | -2.7% |
Source: Bloomberg
| Name | Q3 | YTD | 1 Year |
|---|---|---|---|
| Global Aggregate | -2.5% | -2.7% | -2.4% |
| Global Treasury | -2.0% | -2.9% | -3.3% |
| Global Corporate | -3.4% | -3.2% | -2.5% |
| Global High Yield | -2.2% | -0.1% | 2.1% |
Source: Bloomberg
| Name | Q3 | YTD | 1 Year |
|---|---|---|---|
| Global Aggregate Hedged USD | -2.5% | -1.4% | -0.6% |
| Global Treasury Hedged USD | -2.3% | -1.6% | -1.0% |
| Global Corporate Hedged USD | -3.1% | -1.9% | -1.0% |
| Global High Yield Hedged USD | -2.0% | 0.7% | 3.1% |
Source: Bloomberg
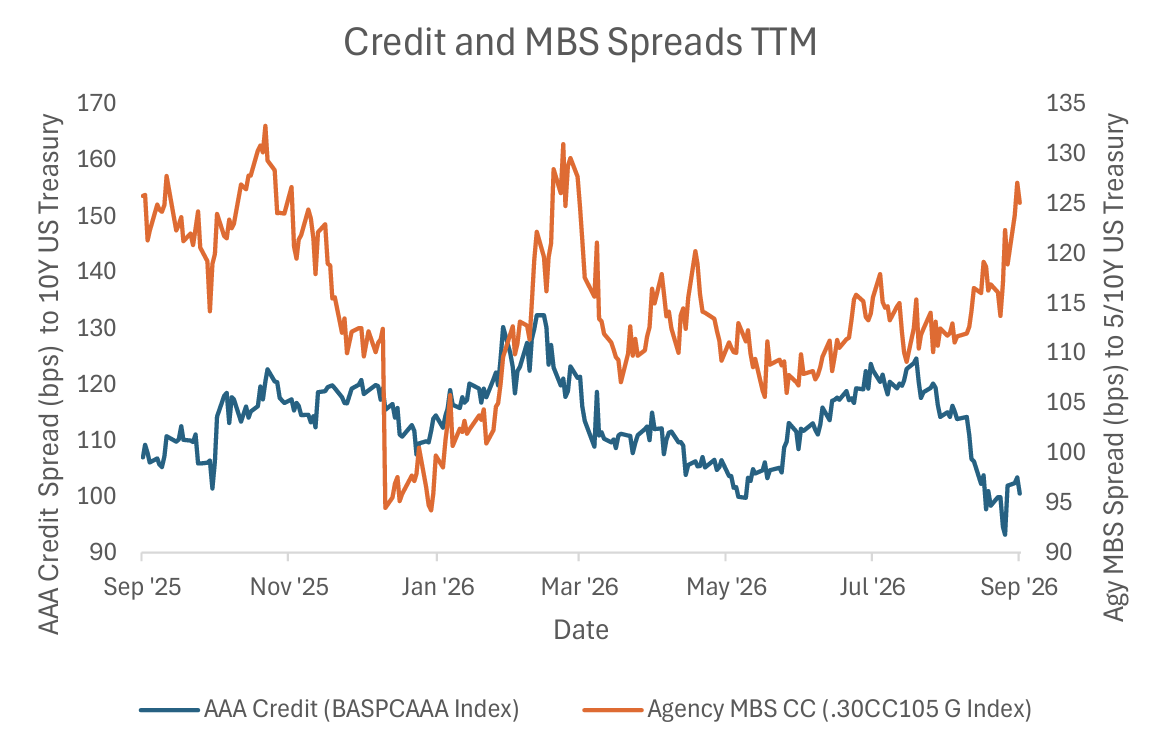
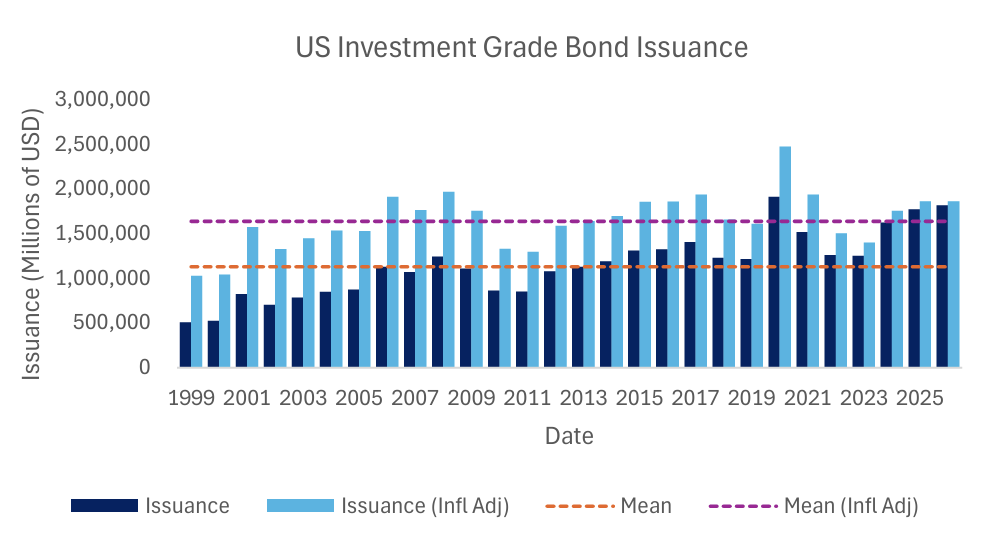
In the investment grade space, increased issuance from hyperscalers has dominated headlines as AI infrastructure investment from many of the same issuers has also increased (of note are 181bn in 2026 offerings by Meta, Alphabet, Amazon, Oracle, and SpaceX). While 2026 issuance is approaching a nominal record, aggregate issuance is less remarkable on an inflation adjusted basis. Highly rated investment grade bonds appear to be little impacted as AAA spreads have tightened by 18bps on the year.
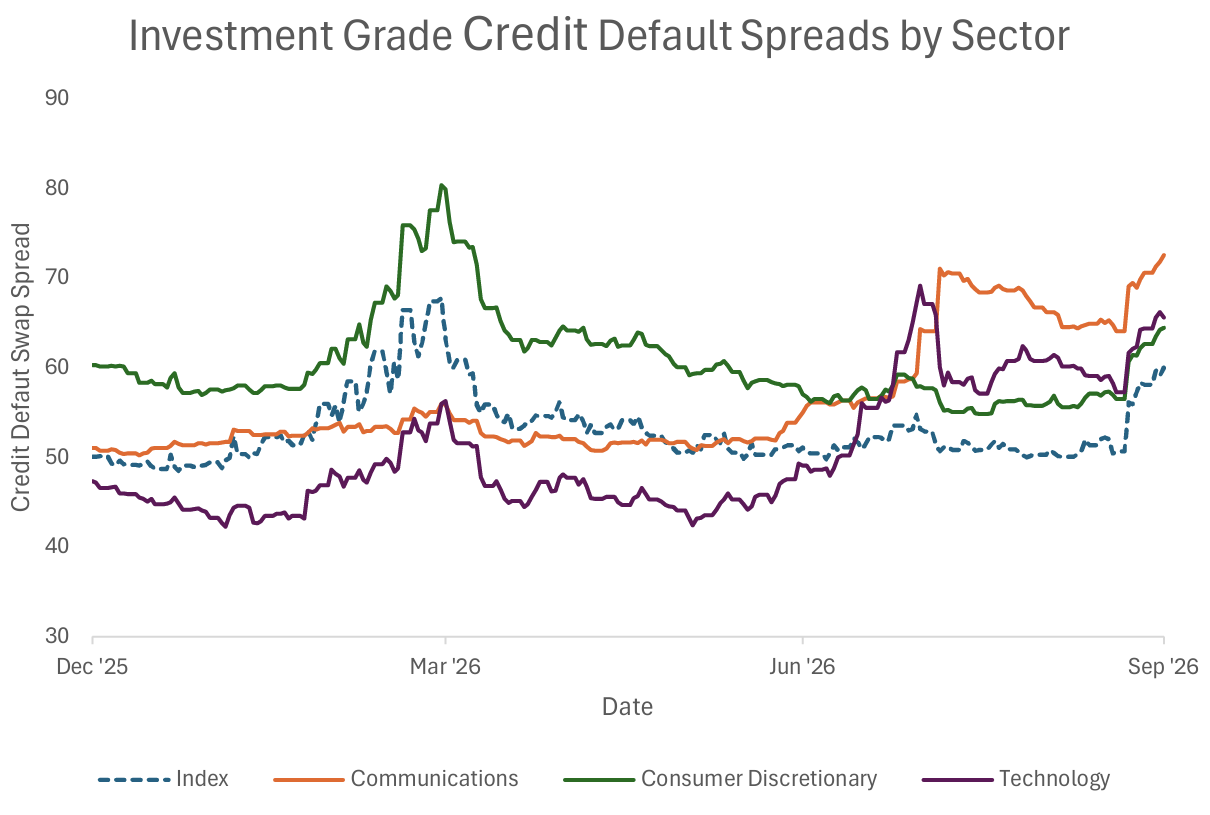
The aforementioned 181bn of issuance was lower in the credit stack (AA or BBB), however, and credit default swap (CDS) spreads on the sectors that house these issuers have widened meaningfully on the year (although they are more or less rangebound for the quarter). Notably, CDS spreads in the Communications sector (which houses Alphabet, Meta, and SpaceX) have widened 22bps on the year vs. 10bps of widening in the index. However, with the exception of Oracle, debt to equity ratios for the five aforementioned issuers have remained below 1x, and with the exception of SpaceX, interest coverage ratios have remained above 4x.
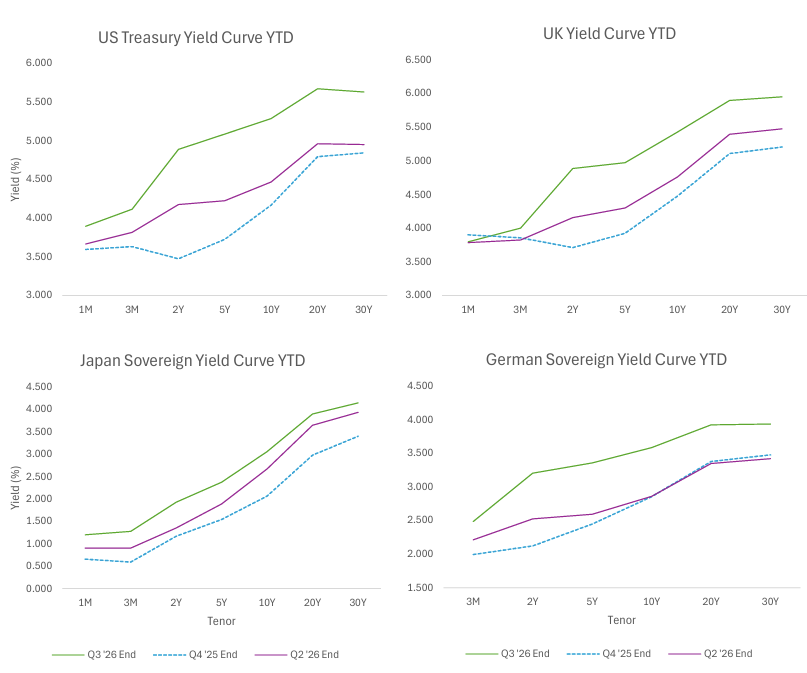
Global yield curves thematically closed the quarter higher, with 2s30s bear-flattening moves occurring in North America, Europe, and Japan as major central banks raised their target interest rates during the quarter (the U.S. Federal Reserve, European Central Bank, and Bank of Japan each hiked).
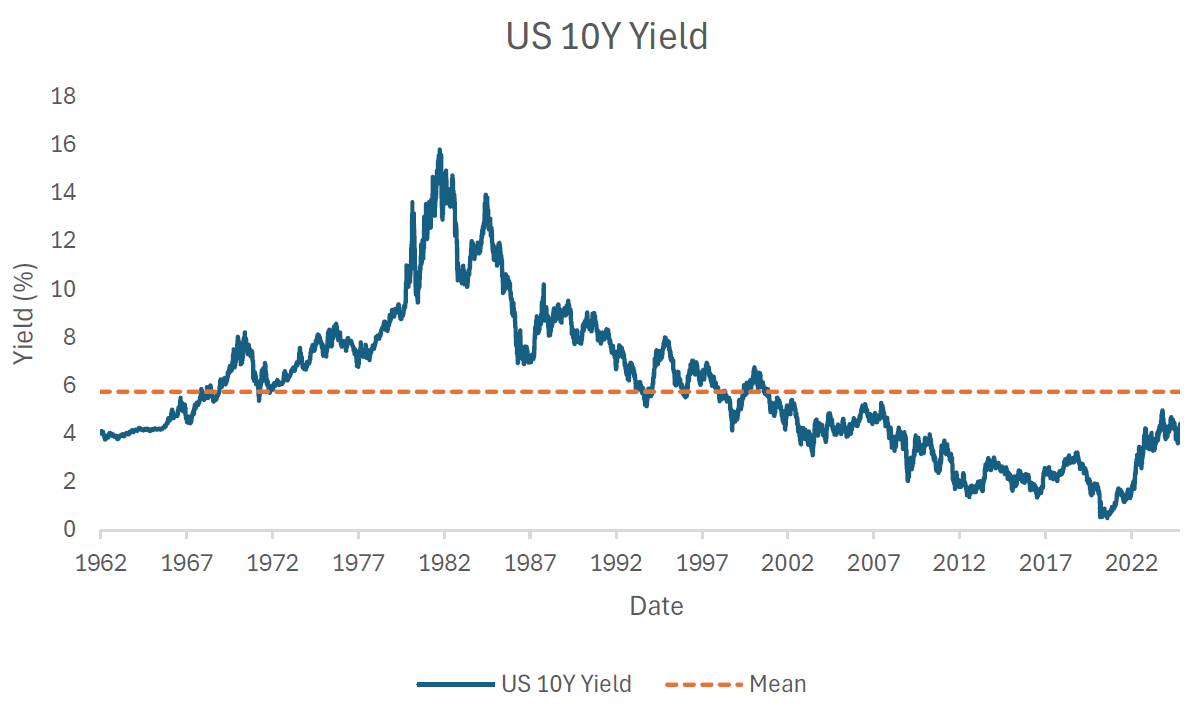
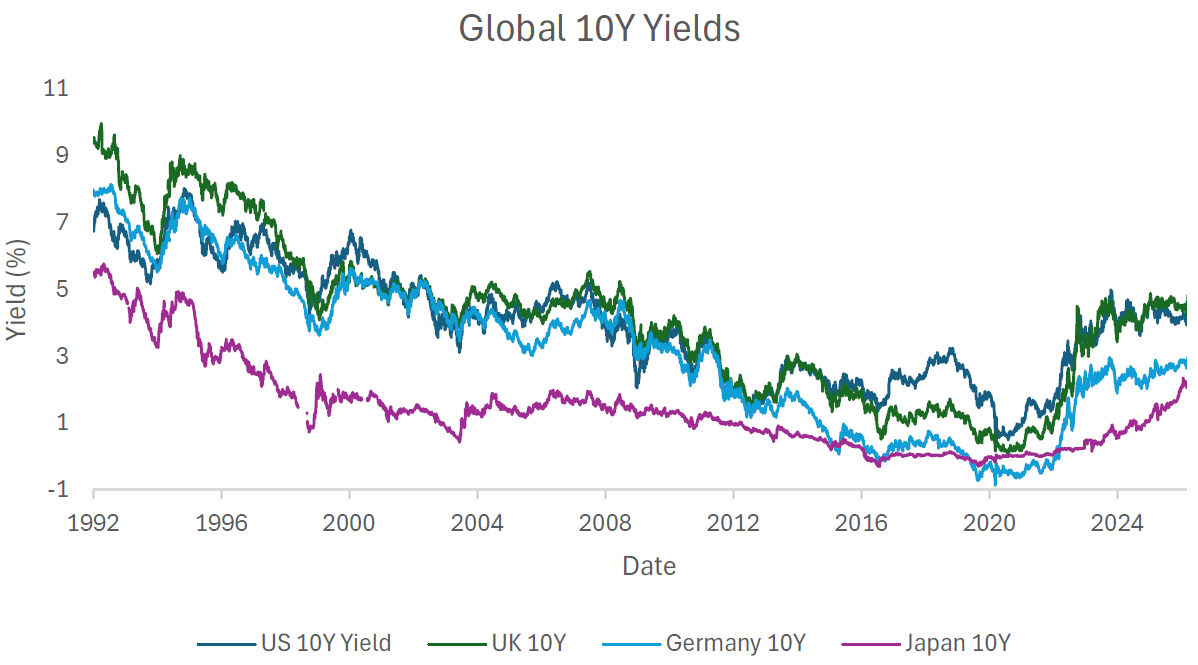
While key rate yields reached levels not seen in over 15 years in multiple countries, all-in levels are not outsized when compared to long-run averages. This is with the exception of Japan, whose 10Y yield of 3.033% at quarter end was meaningfully higher than its 37-year average of 1.79%. The closing gap between domestic and Japanese yields have likely weighed on conviction for the carry trade (a trade in which investors borrow Yen to purchase higher-yielding dollar-denominated assets).
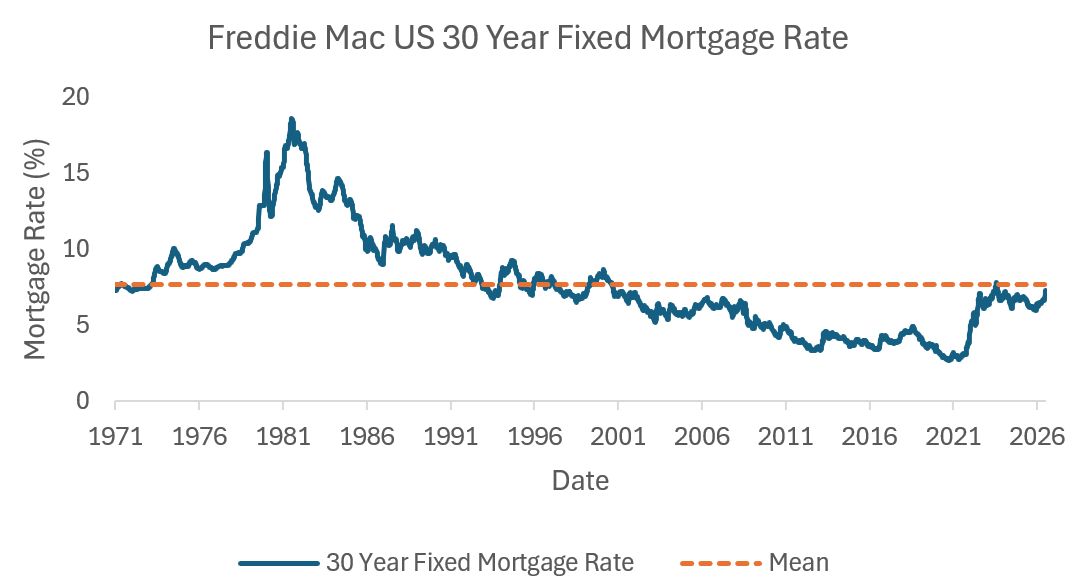
The same pattern applies to mortgages. With the exception of 2023, the rate on a 30-year fixed is at its highest level since 2000 (7.28% as of October 1, according to data from the Freddie Mac Primary Mortgage Market Survey). However, current levels remain below the long-run average dating back to 1971 and well below pre-2000s levels.
In last quarter’s note, we highlighted that Kevin Warsh’s first Fed meeting could be reasonably interpreted as hawkish - even with no change being made to the target rate.
That narrative continued in Q3 as Warsh repeatedly affirmed a 2% inflation target and cited high inflation as a key issue for the committee. At the Jackson Hole Economic Policy Symposium in August, he also expressed a desire for a quieter Fed, emphasized the importance of considering market behavior in policy decisions, and discussed the need to investigate the potential inflationary impacts of AI on the economy.
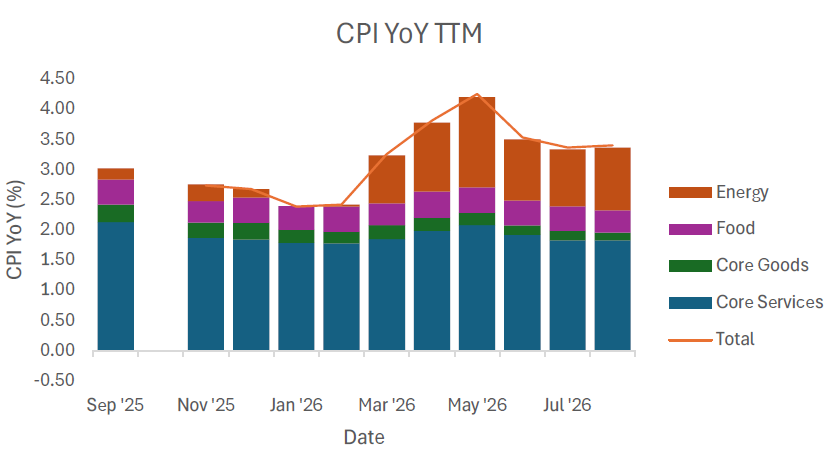
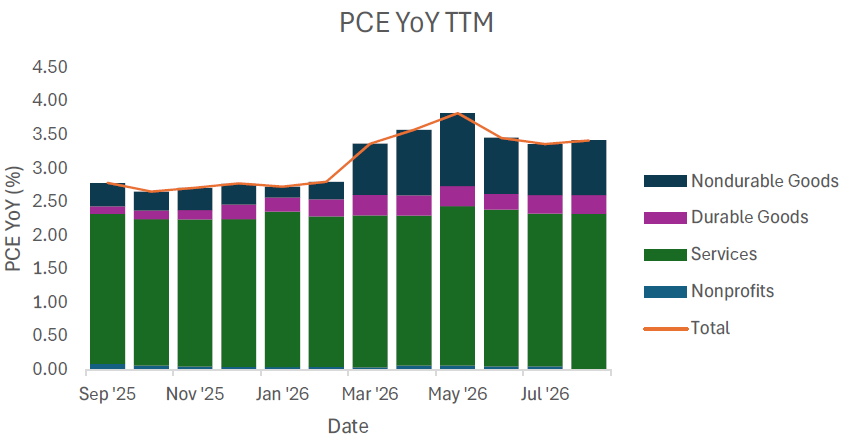
Both measures of inflation (Consumer Price Index and Personal Consumption Expenditures) saw increases due to higher energy prices over the quarter. In previous notes, we focused on the stickiness of inflation in the Core Services category of CPI, which has started to display signs of easing in Q3. From an inflation perspective, this is supportive of a higher-for-longer policy with room for modest tightening should the data indicate a directional change to the upside, particularly in Energy markets.
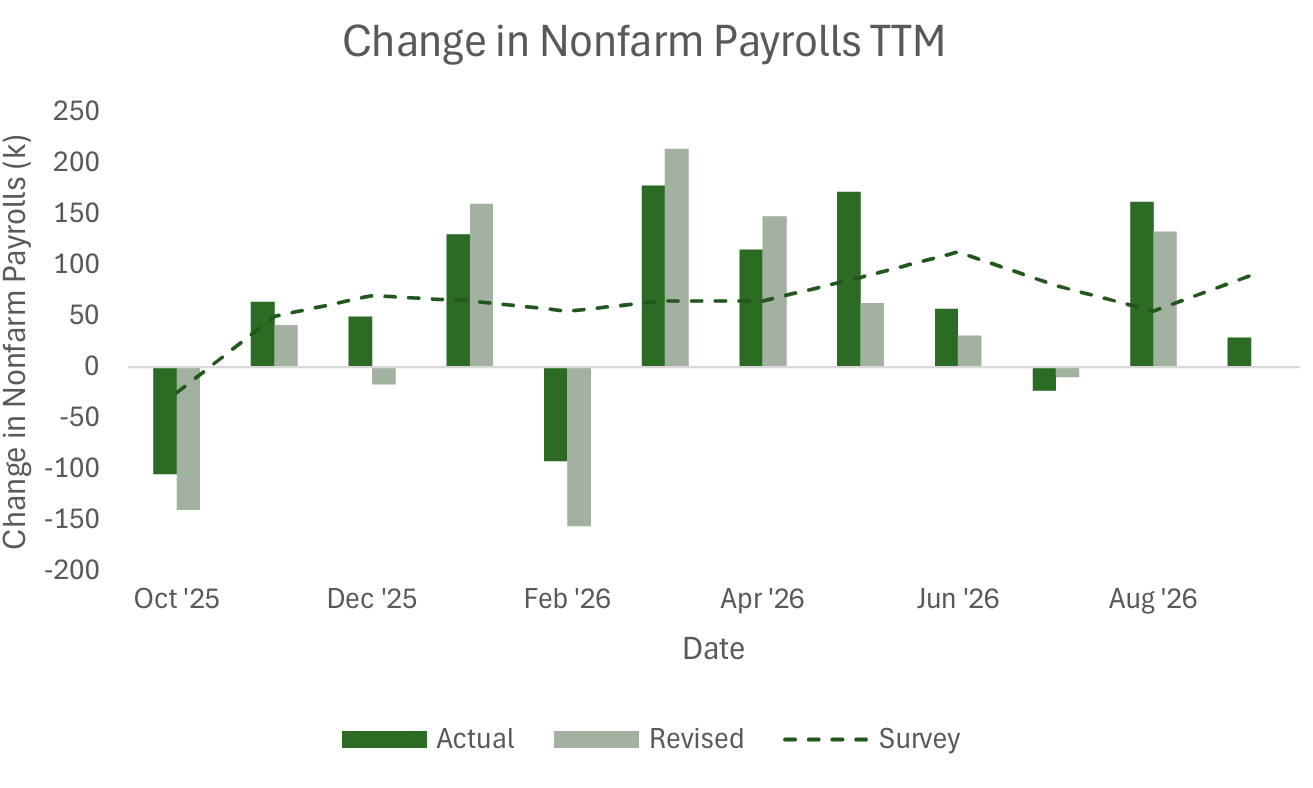
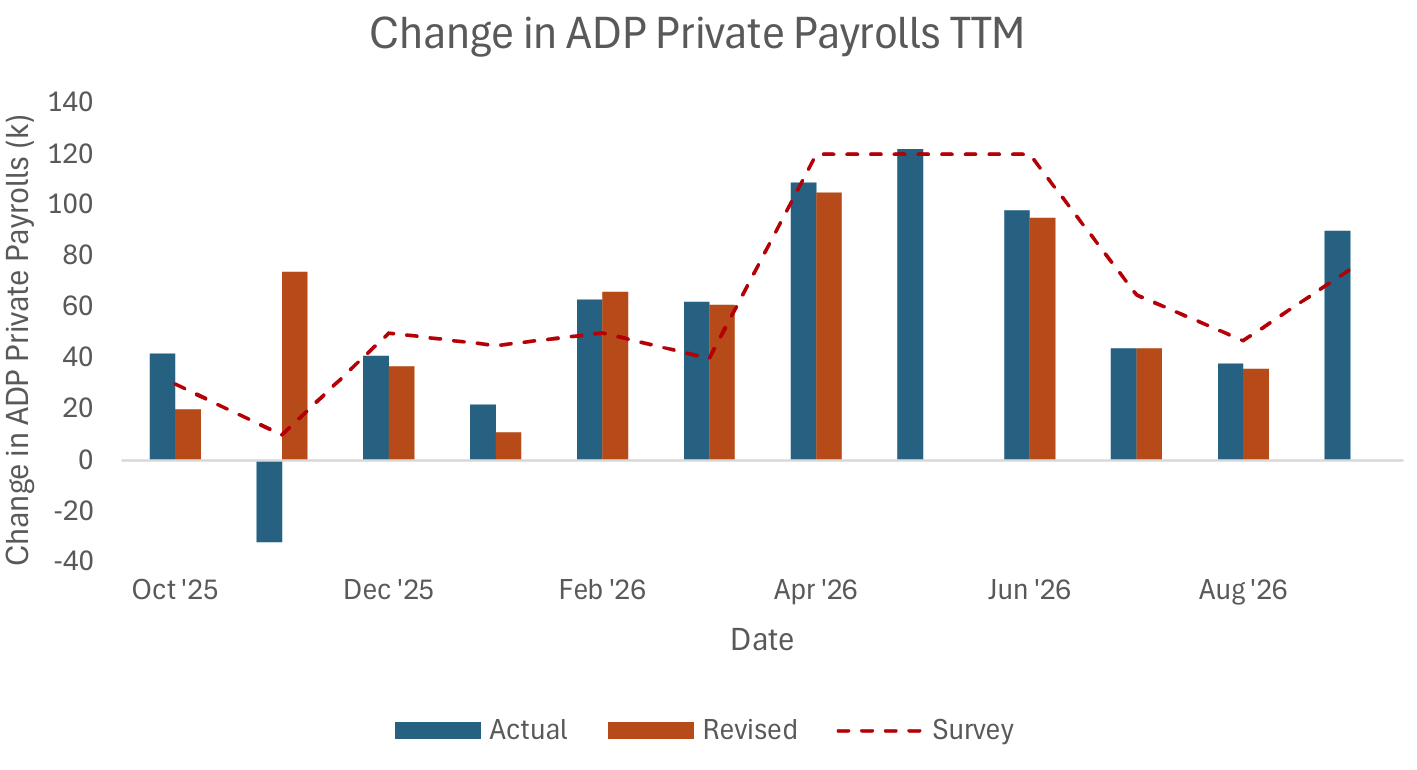
While there have been several pockets of weakness in labor data, the overall trend suggests resilience in the labor market and is therefore also supportive of a higher-for-longer policy, contingent on new data.
The direction of the data, particularly inflation, were key in supporting the Fed’s unanimous decision to raise the target rate by 25bps in September. With the certainty of a September hike and relatively cooler August jobs reports, rate hike bets for 2026 (as implied by the Fed Funds Futures market) faded to 1.185 implied hikes by year-end from 1.507 implied hikes the quarter prior.
While front-end domestic yields rose sharply over the quarter (2Y +71bps), the long end of the curve also sold off meaningfully (30Y +68bps). Notably, the U.S. Treasury announced plans to double the maximum size of its long-dated Treasury buybacks to $4bn per operation in mid-August. While the announcement did little to reverse the selloff in duration, it carries important implications for Treasury’s role in supporting liquidity in the long end of the curve.
Duration suffered on the quarter and IG corporates are beginning to face supply pressures, yet all-in yields on sovereign debt are at attractive levels that are orderly in the broader historical context. IG spreads remain intact, and major hyperscaler debt issuers are maintaining reasonable leverage and coverage ratios, despite some widening in CDS markets. We will continue to monitor sentiment from global central banks, inflation and labor dynamics, and issuance / leverage in the corporate bond space as we approach year-end.
October 20, 2026
Certain statements made by us may be forward-looking statements and projections, which describe our strategies, goals, outlook, expectations, or projections. These statements are only predictions and involve known and unknown risks, uncertainties, and other factors that may cause actual results to differ materially from those expressed or implied by such forward-looking statements. While information is believed to be reliable, we do not guarantee its accuracy or completeness. The information contained herein represents our views as of the aforementioned date and does not represent a recommendation by us to buy or sell a security or any other financial instrument associated with it. Secure Asset Management, LLC, our clients, and our employees may buy, sell, or hold any or all of the securities mentioned. We are not obligated to provide an update if any of the figures or views presented change. Past performance is not indicative of future results. Secure Asset Management, LLC does not register as a commodities firm, and as such, advisors may not recommend commodities or cryptocurrency outside of packaged products. Indices are unmanaged and cannot be invested in directly. Returns assume dividend reinvestment unless otherwise stated. Unless otherwise specified, data is sourced from Bloomberg. Yield changes in U.S. Treasuries are derived from Bloomberg’s Mid YTM closes in the Graph Curves function, and Forward Rates are calculated using Bloomberg’s Forward Curve Analysis function. YoY refers to “Year over Year,” TTM refers to “Trailing Twelve Months,” YTD refers to “Year to Date,” and PCE refers to “Personal Consumption Expenditures.” Change in Nonfarm Payrolls revisions data may differ from previous Newsletters as revisions are released by the Bureau of Labor Statistics (BLS) twice following each month’s print and can be revised in the BLS annual benchmarking revision, which targets two years of trailing data. The information provided is for educational purposes only and should not be considered financial, investment, tax, or legal advice.
At Secure Financial Group, we understand that building a successful financial practice requires not only expertise but also a solid foundation of security and trust. You see, all of our companies have been created and grown from the advisor’s perspective – we’ve done it. We have in house money managers, Attorney’s, Accountant’s, Lending and Risk Managers.
The Secure Financial Group family of companies was founded in 1997 when Secure Investors Group launched as an insurance firm devoted to bringing superior insurance products to clients. Since then, Secure Financial Group has transformed into a comprehensive financial firm, partnering with financial advisors nationwide. All told, Secure Financial Group with its affiliates, Secure Investors Group, Secure Asset Management and Aurora Securities, advise and/or manage over 4 billion in assets.


Please reach out to our team at 248-414-1590 to set up a conversation to learn more about your business and share information about us and see if it makes sense to continue the conversations in a deeper opportunity. If you prefer, use the calendar link to schedule a 15-minute introduction call.
Schedule 15-minute CallAll written consent on this site is for information purposes only. Opinions expressed herein are solely those of Secure Investors Group and our editorial staff. Material presented is to be from reliable sources; however, advisory services are offered by Secure Asset Management, L.L.C., a Registered Investment Advisor.
Insurance services offered through Secure Investors Group. Advisory services offered through Secure Asset Management, L.L.C., a Registered Investment Advisor. Tax services offered through Secure Tax Services, L.L.C. Mortgage services offered through Secure Mortgage Funding, L.L.C. Securities offered through Aurora Securities, Inc. (ASI) Member: FINRA/SIPC. The aforementioned companies are all affiliated companies and maintain common ownership. They do not offer legal advice or services.
Advisory services are offered through Secure Asset Management, LLC., a registered investment advisor. For additional detailed information about Secure Asset Management, including fees, services, and other important information, please visit www.Investor.gov/CRS or carefully read our current Client Relationship Summary (ADV Part 3) , Disclosure Brochure (ADV Part 2A), and Privacy Policy.