
After two exceptionally strong years in US markets with consecutive 23%+ gains, domestic equities closed lower in the first quarter of 2025 amid heightened economic and political uncertainty. The S&P 500 and the Nasdaq Composite experienced their biggest quarterly drop since 2022, with the S&P 500 Index dropping 4.3%, and the Nasdaq Composite falling just over 10% for the quarter. This broad market selloff continued for most cyclical areas of the markets as the on and off nature of tariff negotiations and threats intensified.
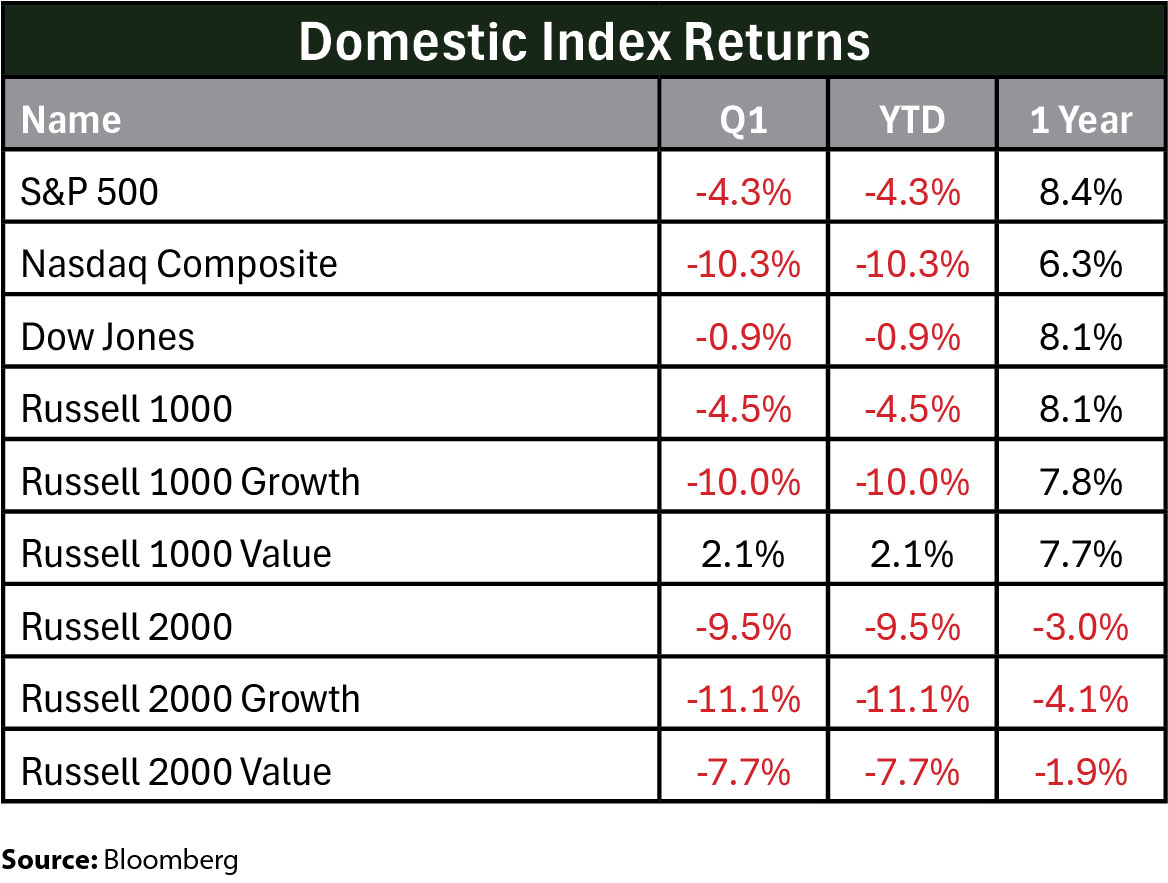
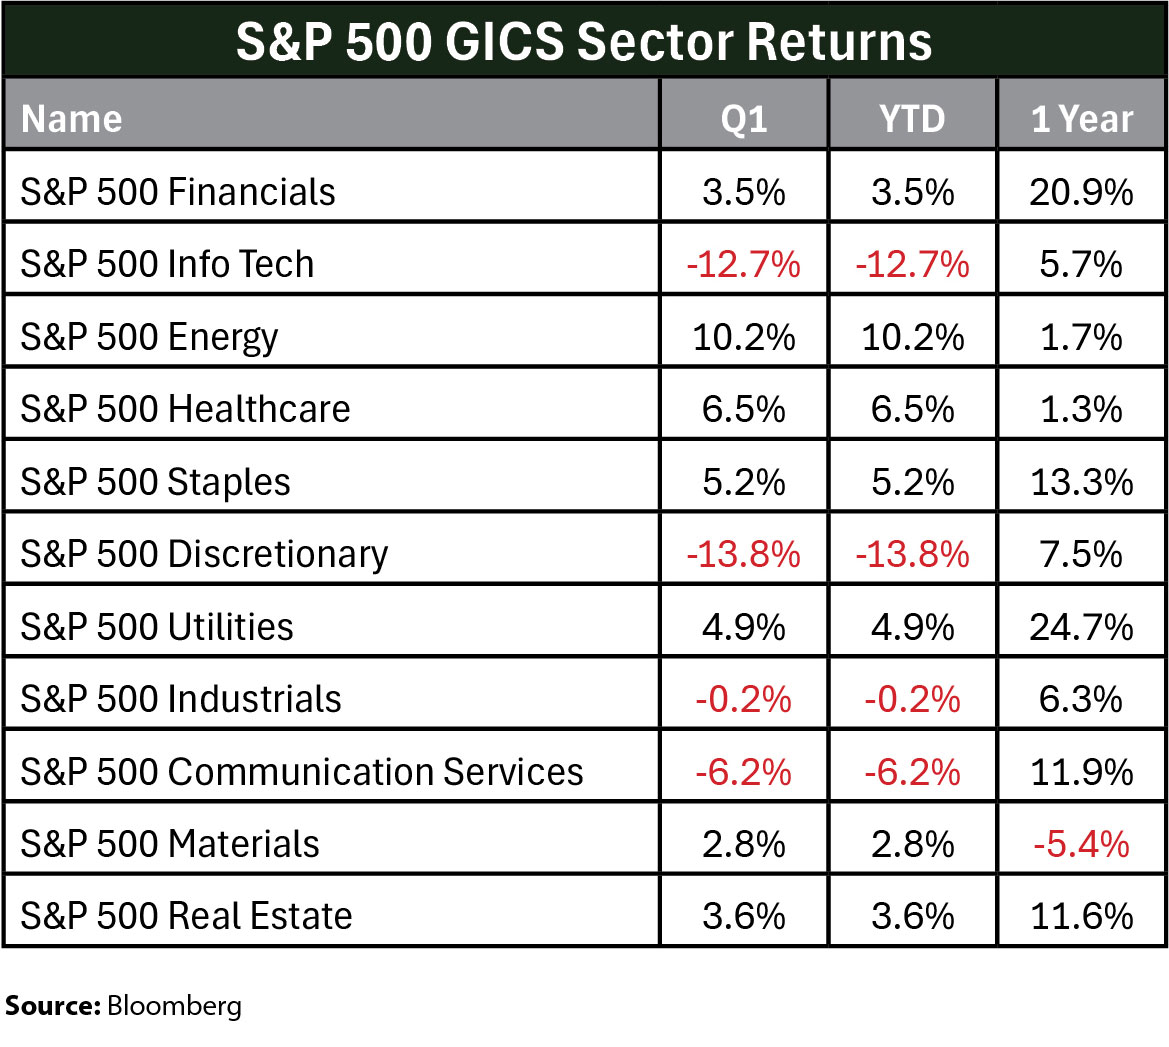
US stocks started the year strong, with the S&P 500 gaining a little over 4.5% and hitting an all-time high in February just before President Trump’s tariff policies shocked markets around the globe, proceeded by a sharp 10% selloff from all-time highs. In the U.S. investors rotated out of consumer discretionary and information technology sectors in favor of more defensive and value plays with healthcare, utilities, and staples. Energy was the strongest sector fueled by rising global demand expectations.
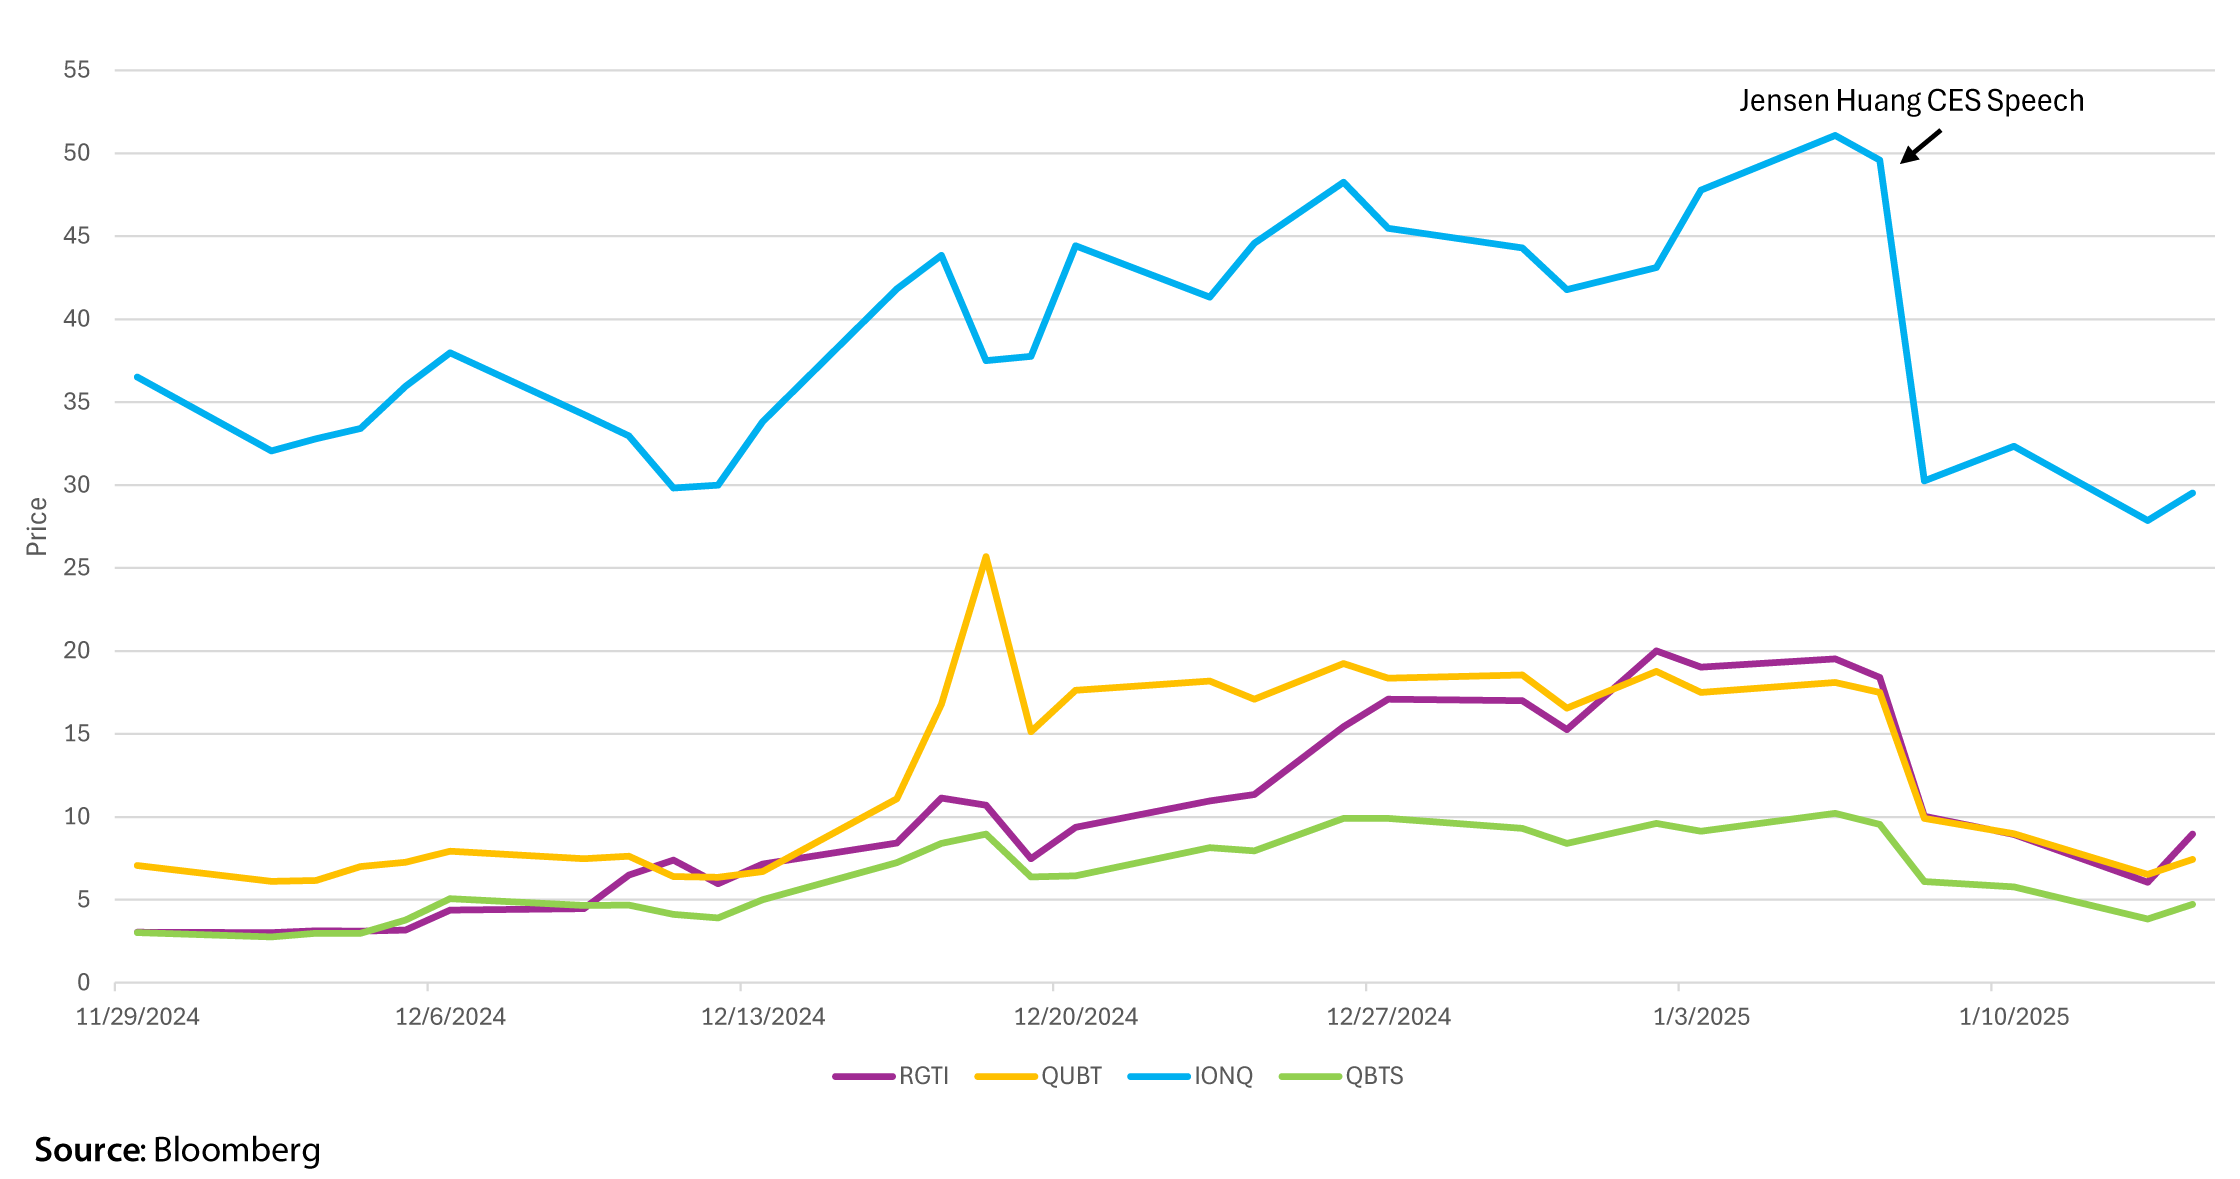
January was a shock to tech stocks and their peripherals as DeepSeek, a divergent and inexpensive Chinese AI platform, unsettled investor expectations surrounding domestic tech valuations and AI spend. Moreover, quantum computing stocks plunged in early January after Nvidia’s CEO Jensen Huang spoke at the Consumer Electronics Show in Las Vegas, stating that useful quantum computers are likely “a few decades away”.
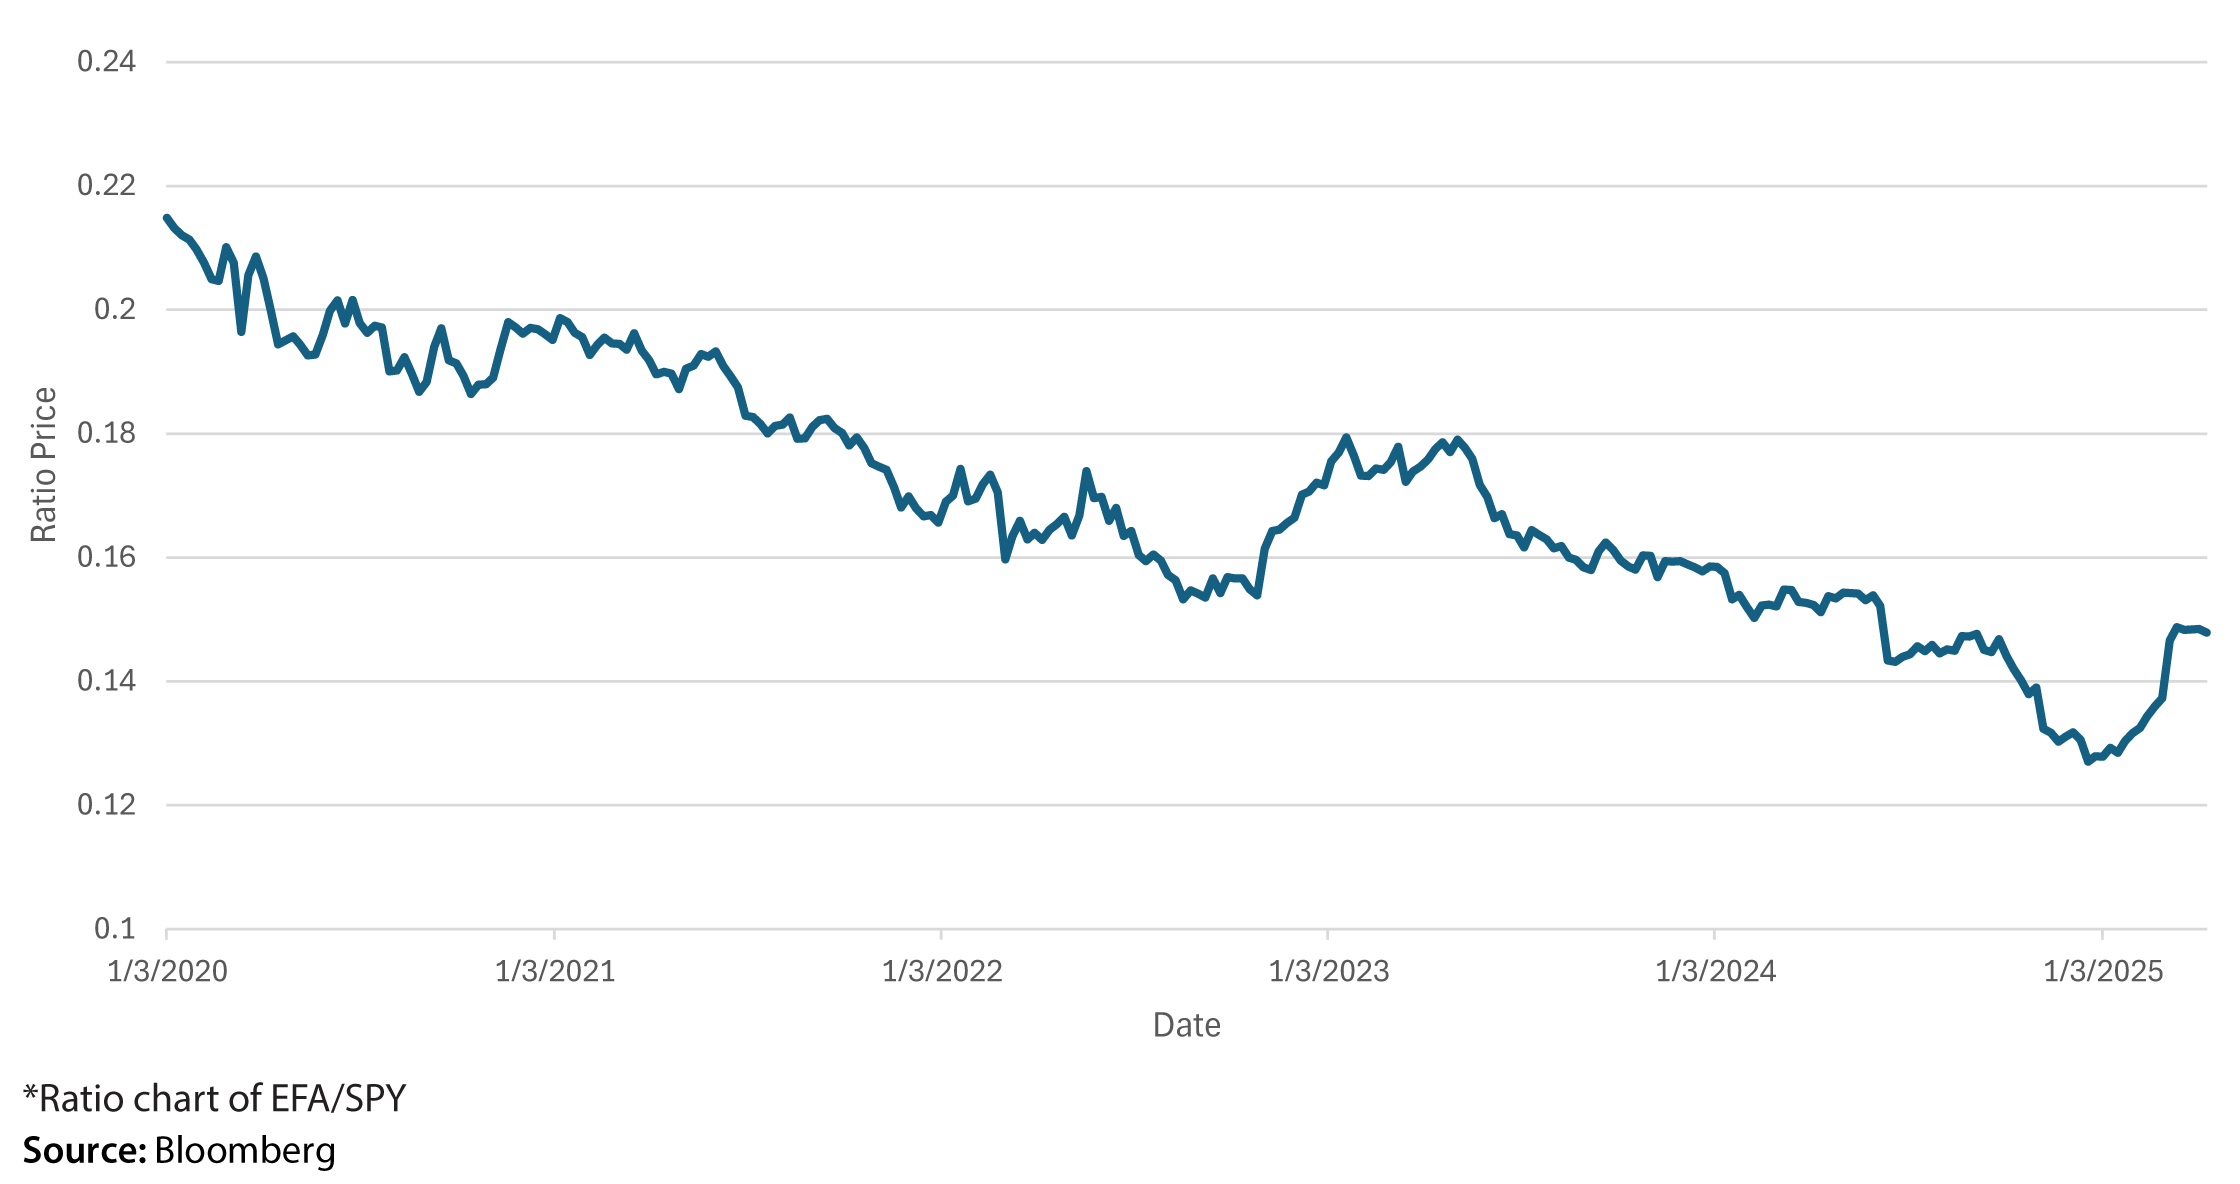
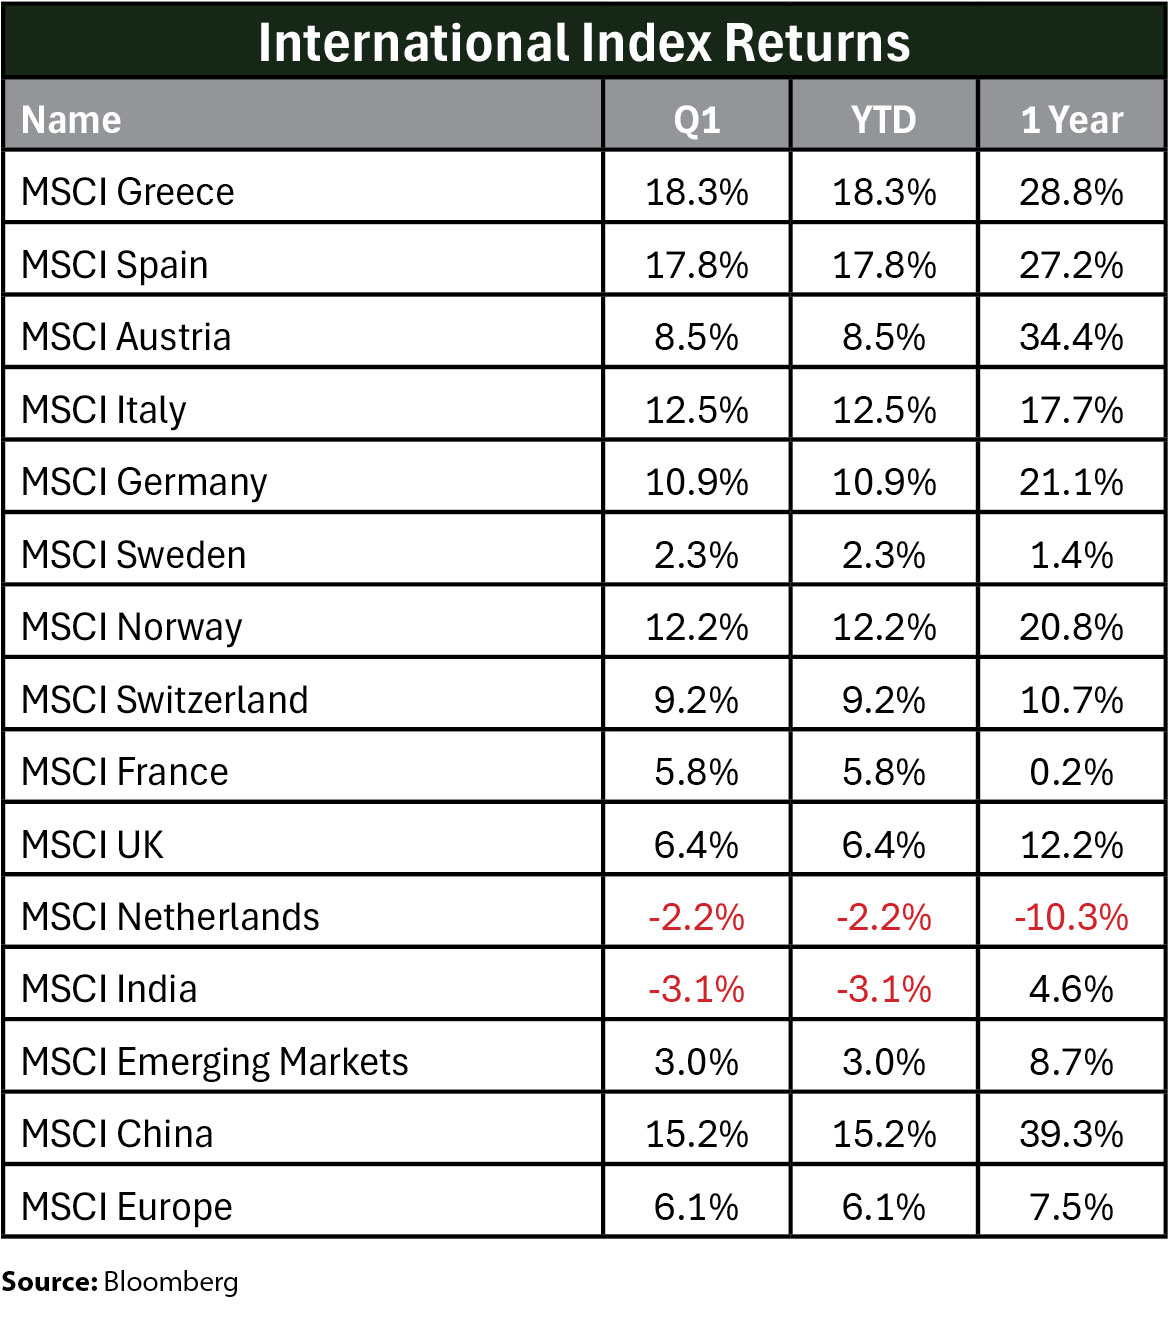
Following a difficult fourth quarter in 2024, driven by fears of tariff impacts and the potential for a global trade war, international equities saw a reversal in the first quarter of 2025. Developed international and emerging market stocks bucked a decade long trend of underperformance relative to US stocks, leading to a significant (10-14%+) total return spread between international and domestic equities. The MSCI EAFE and MSCI EM indices advanced 7% and 3%, respectively.
International equities in Europe were particularly strong, with Defense, Banks, and Infrastructure being the clear sector winners. The rally in defense was supported by expectations of a rearmament campaign across Europe, while manufacturing also advanced as investors bet on potential infrastructure modernization efforts in Ukraine. Emerging markets posted modest gains, supported by stronger-than-expected economic data from China along with promising innovative technology in the AI/Tech and EV market segments.
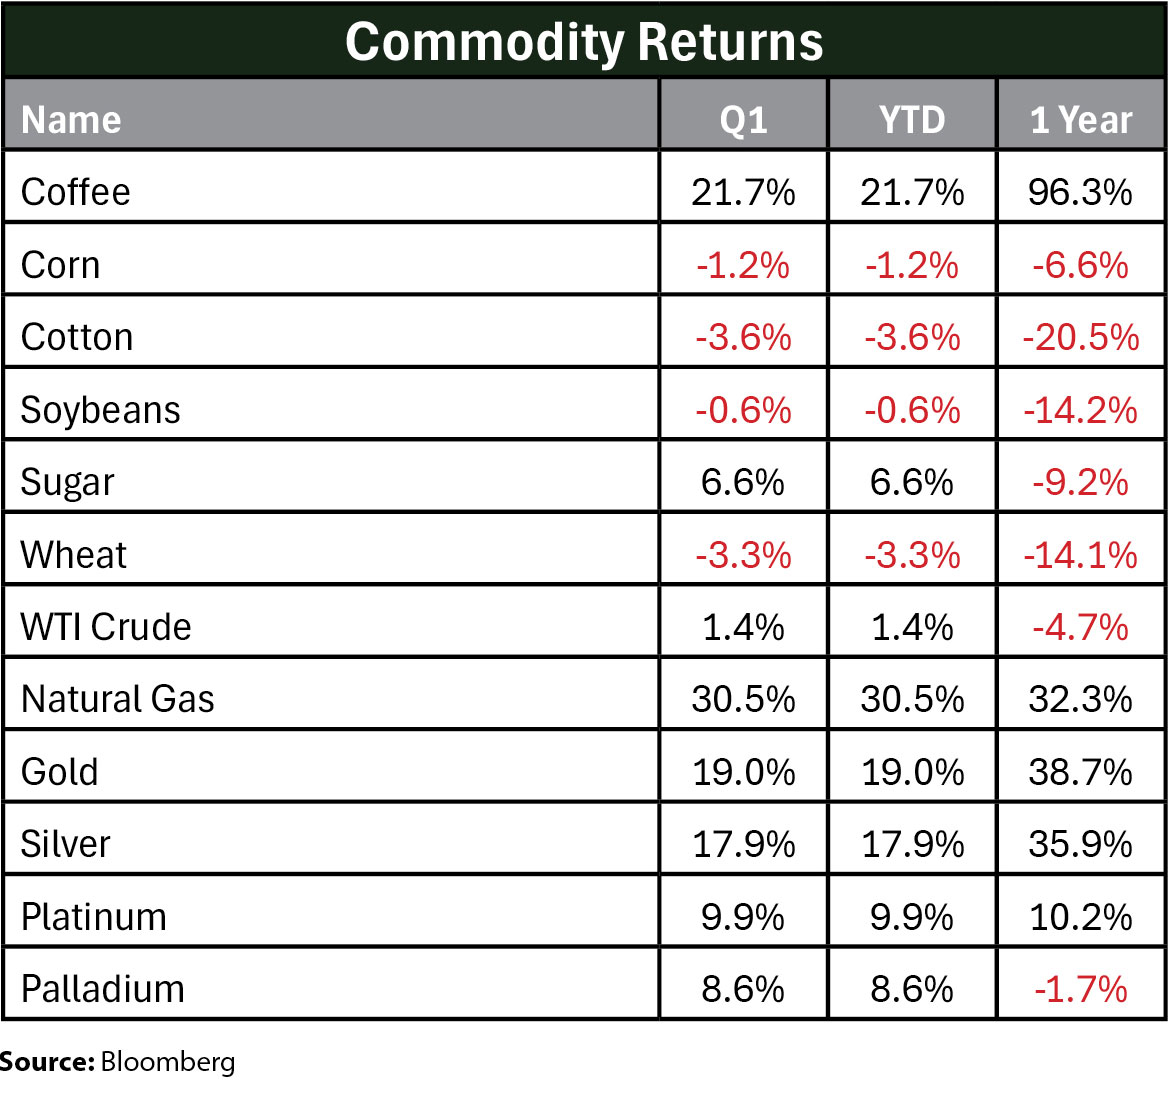
Despite turmoil in equity markets, commodities performed relatively well for the quarter, with strength in precious metals as gold hit a record high over $3,100/oz, and silver hit a multi-year high over $34/oz, advancing 18-19%, powered by increased demand and a weaker US dollar. Oil went for a wild ride, advancing in early January, plunging over 17% from its mid-January highs, and then recovering to finish the quarter about 1.4% higher on news of higher expected demand in Europe.
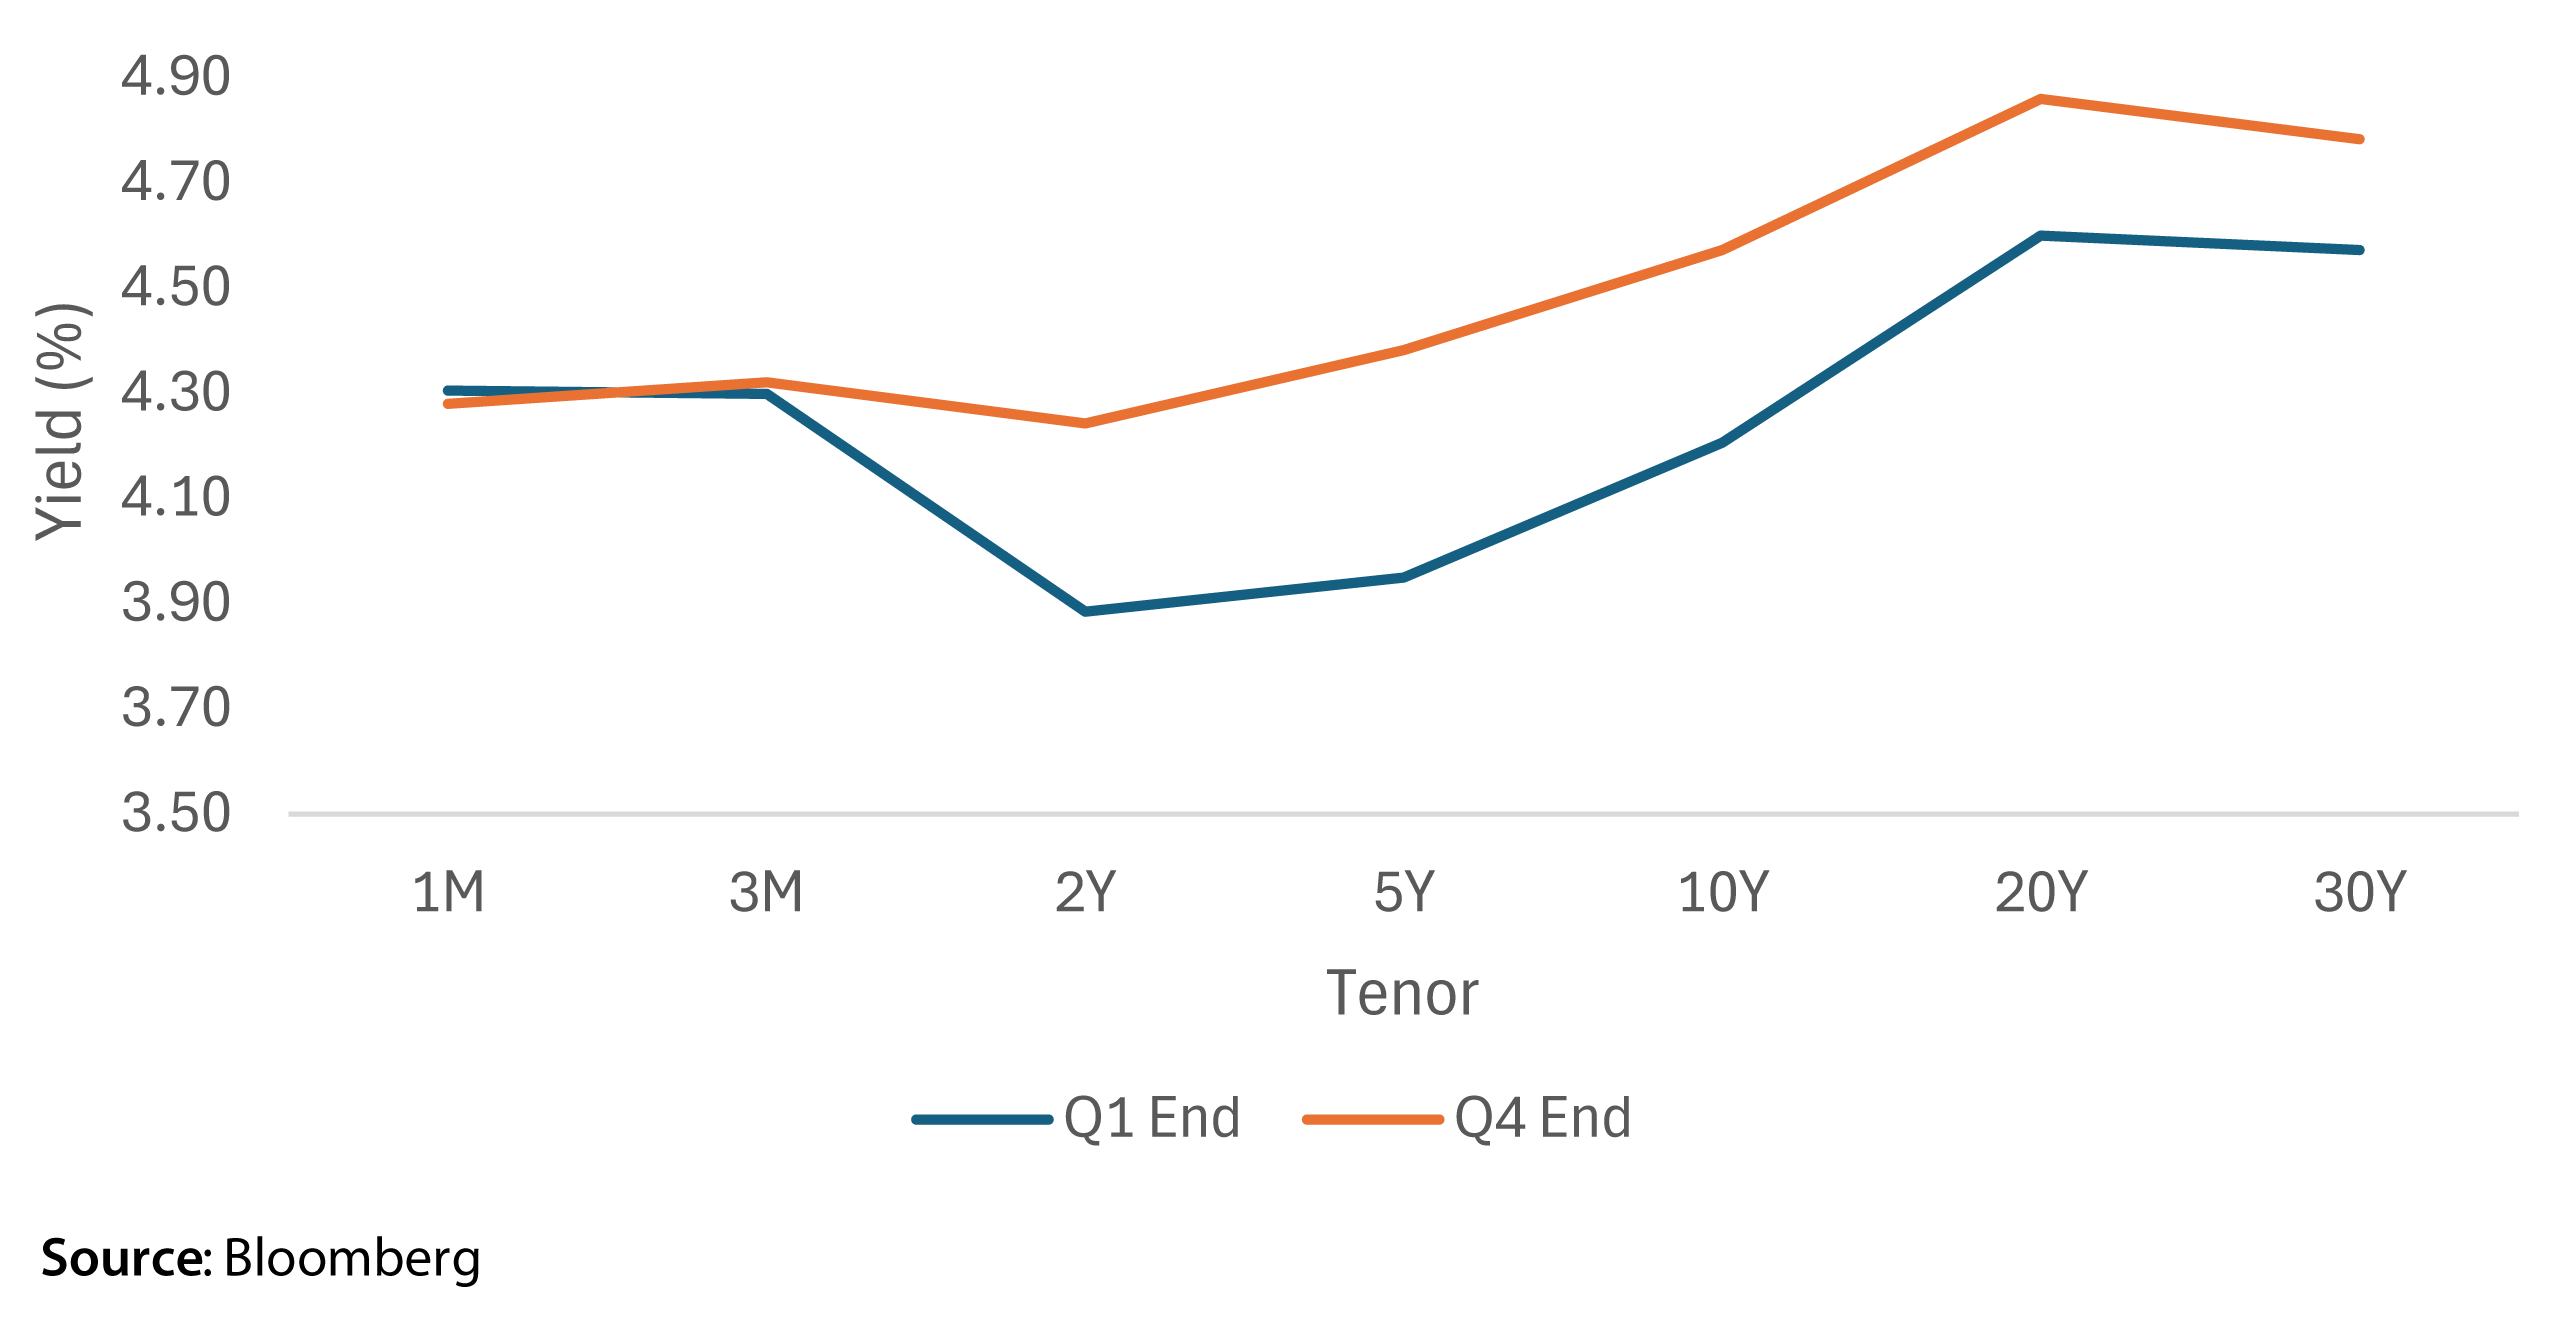
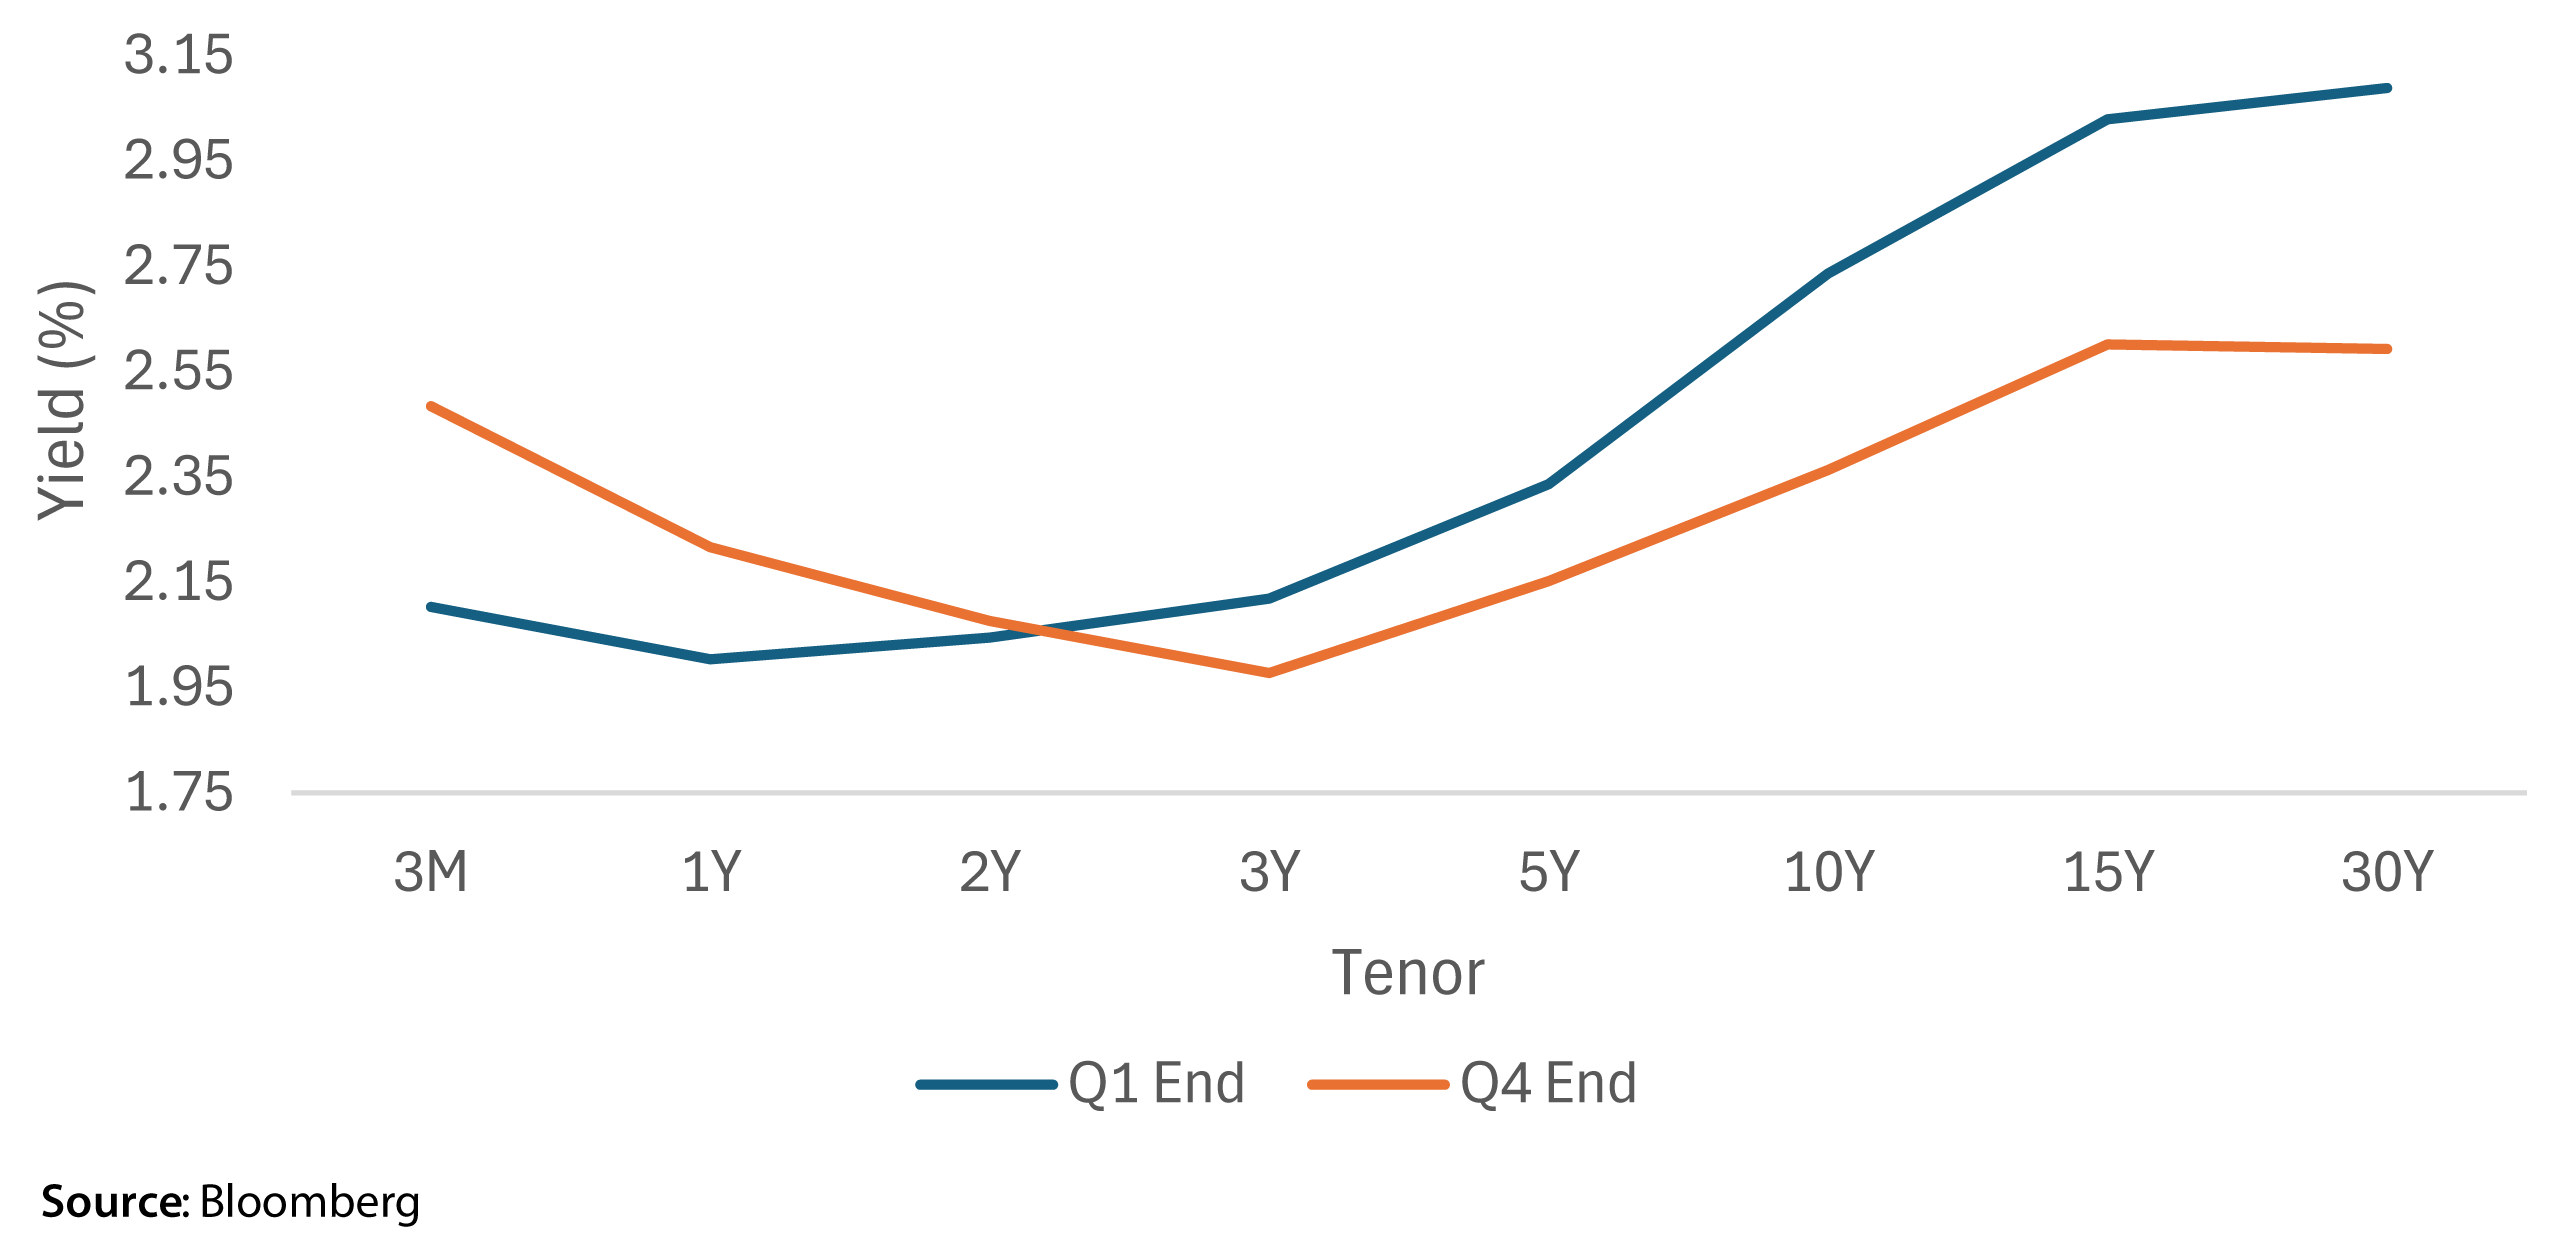
Equity markets were risk-off for the second half of Q1, with capital pouring into high quality fixed income assets. Despite a lack of cuts and higher for longer outlook from the Fed in 2025, yields rallied materially in the belly of the curve (-43bps in the 5Y). This was a reversal in sentiment from the drift higher and bear steepening that dominated Q4.
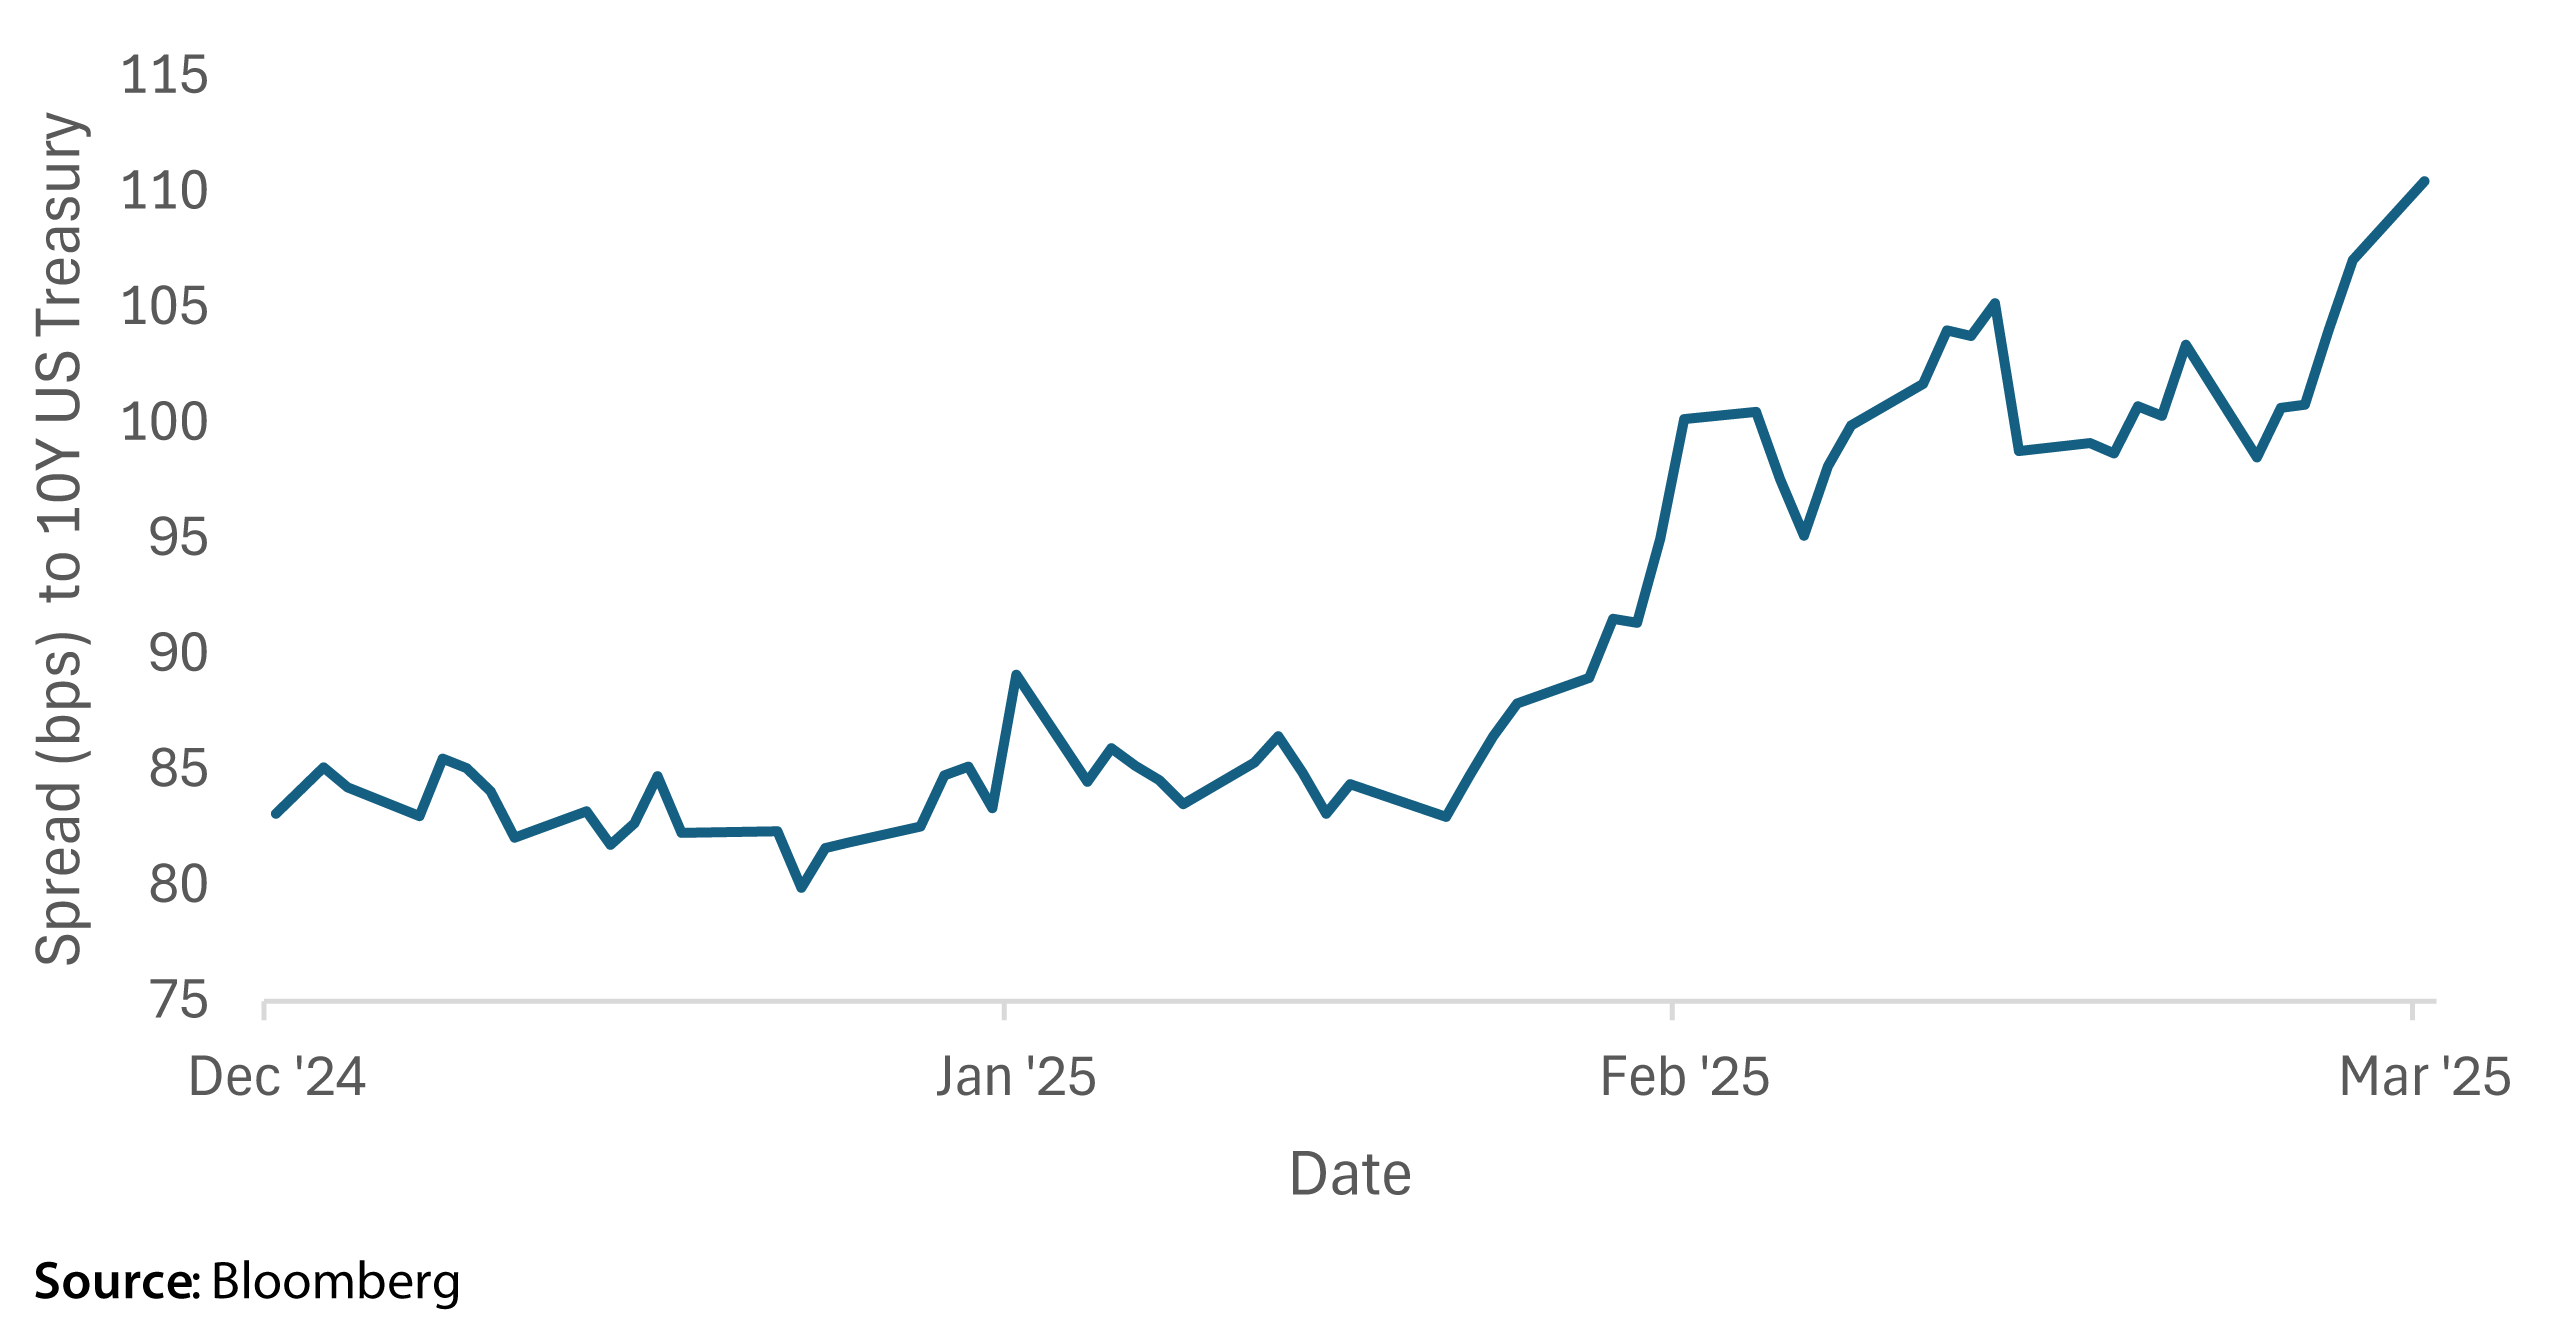
Given the nature of the move, credit products were not as well bid in Q1. Investment Grade AAA corporate spreads widened by 27bps on the quarter to 110bps as of Q1 end (according to Bloomberg’s BASPCAAA Index, which subtracts the 10Y US Treasury Yield from Moody’s Bond Indices Corporate AAA Index [MOODCAAA] Index). In one of our previous notes, we underscored the richness of credit spreads and a case for them to widen out to low triple digits. As the market digests the volatile flow of information on the US trade stance and economic outlook, investors are pricing in higher credit risk.
International bonds experienced the opposite in Q1 – stimulated by a sharp pivot in fiscal policy. Following a heated televised negotiation between the US and Ukraine, the EU put together an €800 billion defense package and Germany increased its debt limit. European bonds rose in response to the fiscal policy changes, the 10Y bund selling off by more than 30bps on March 5, its largest one-day selloff since 1990. European growth, which has been muted, may be stimulated by fiscal policy, necessitating less cuts by the ECB (in the month of March, the number of ECB cuts priced in for 2025 decreased by 1).
With the tough US trade stance and onset of tariffs, the Fed has been left with very little wiggle room to lower rates. On one hand, policy remains restrictive and US consumer data and sentiment are weakening, with retail sales prints through February coming in below consensus (-0.9% Jan vs. -0.2% consensus, 0.2% Feb vs. 0.6% consensus) and the University of Michigan Consumer Sentiment survey declining 19% on the quarter.
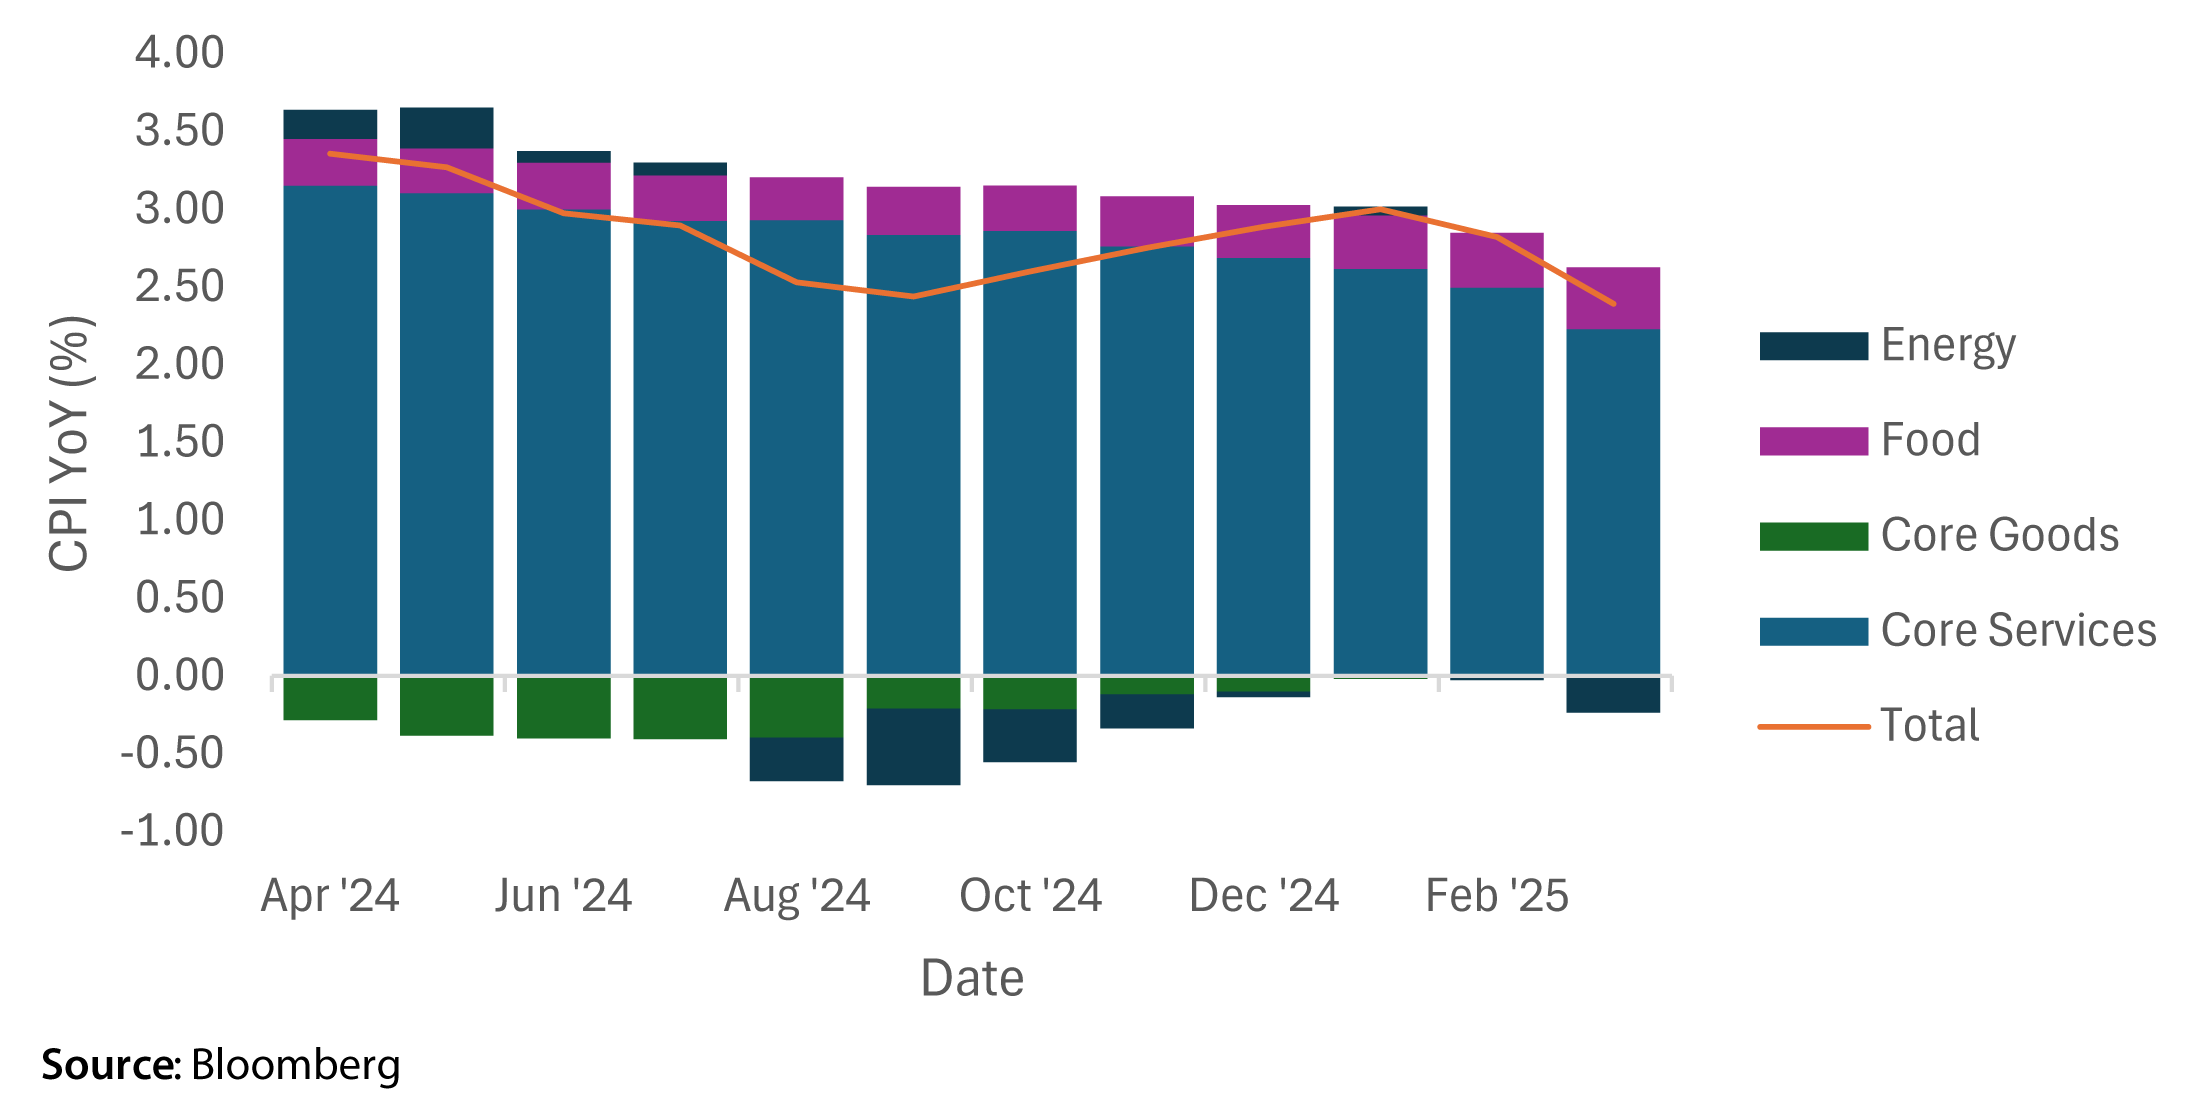
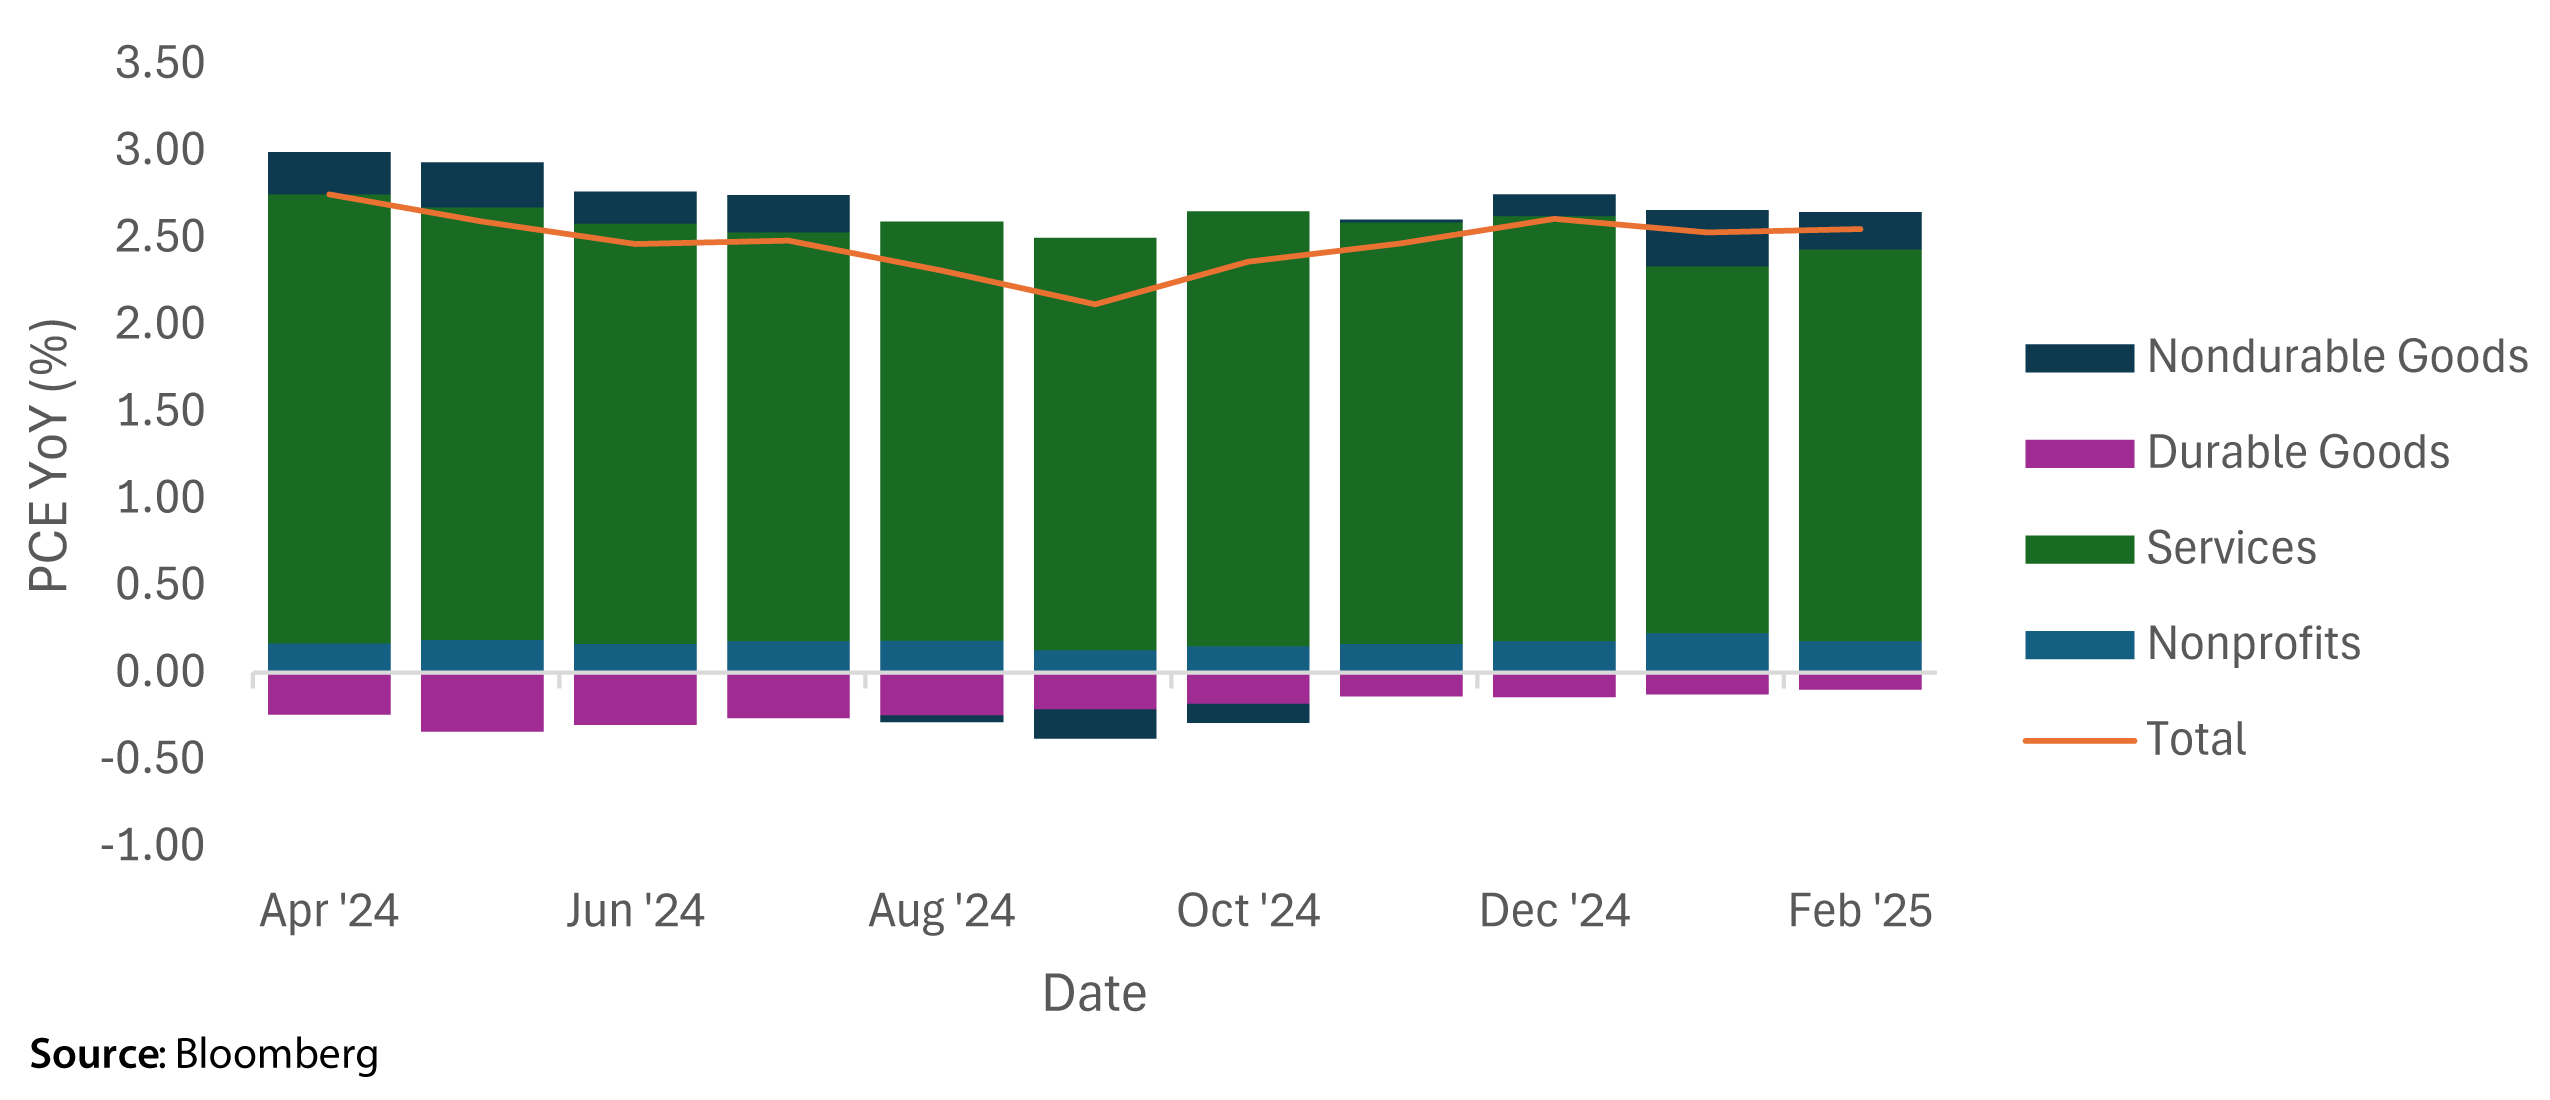
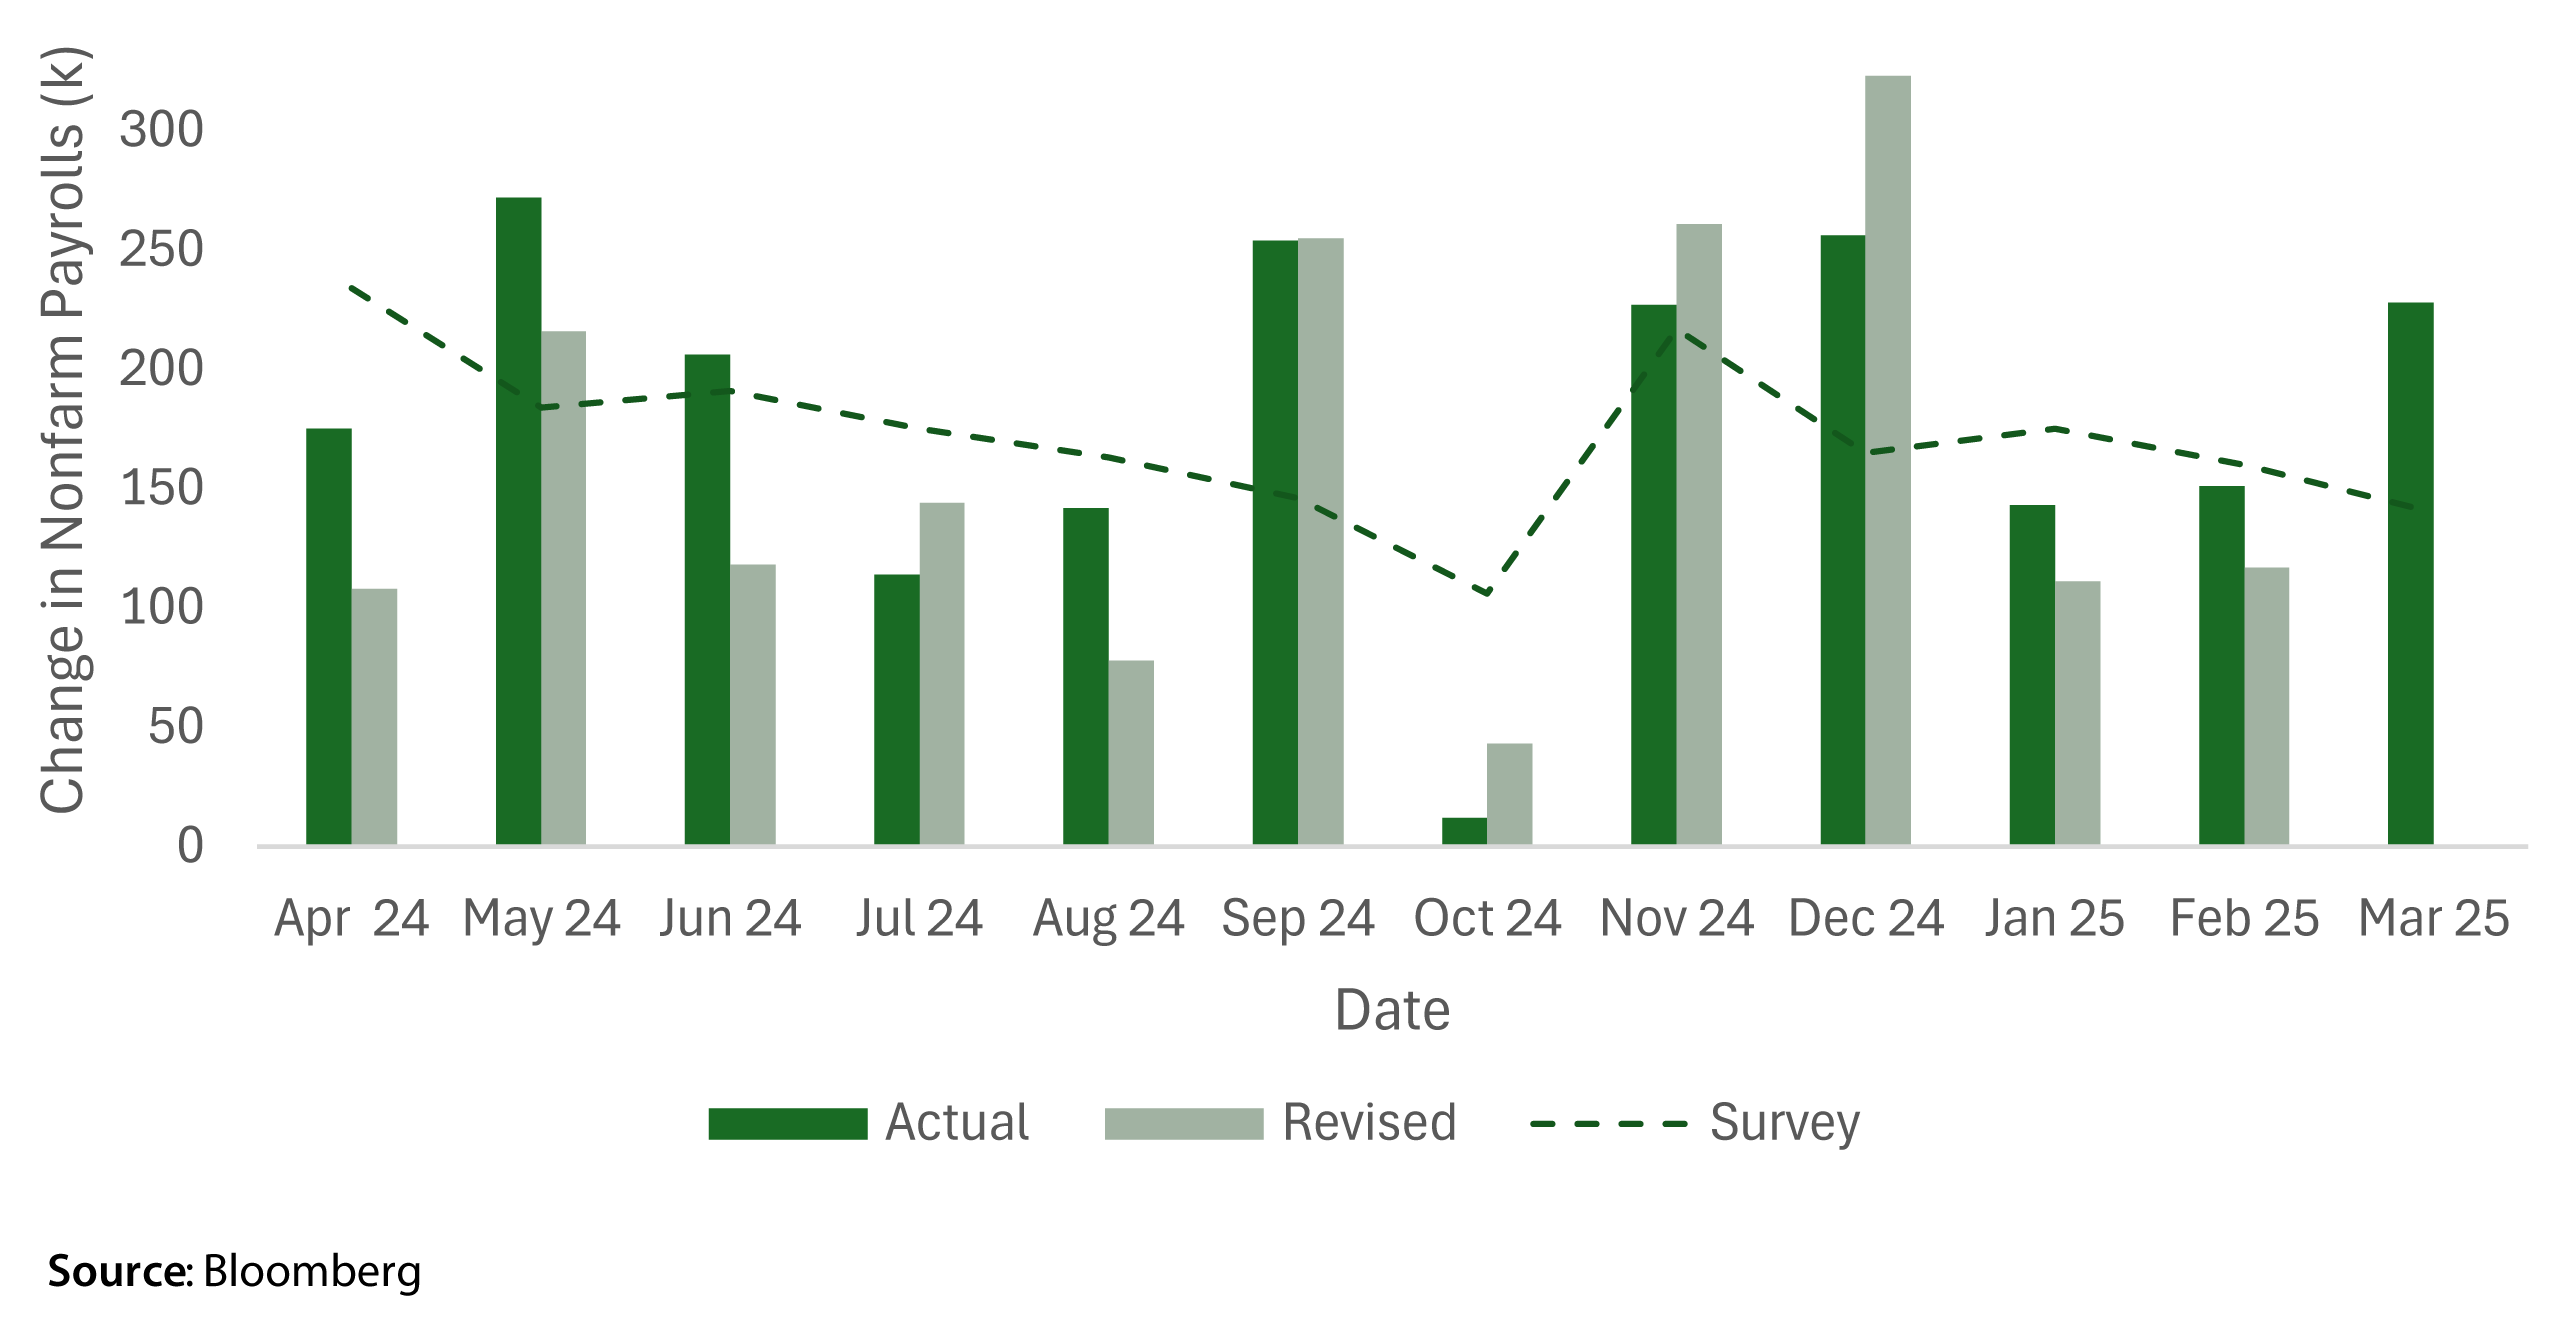
On the other hand, core services inflation remains elevated and has the potential to increase as the delayed effects of tariffs start to feed into the data. Jobs data has recently been resilient but may show weakness in future prints as the Department of Government Efficiency cuts are reflected. Unless the Fed has a basis in the data to cut, their toolbox is limited, despite 3 cuts being priced in for 2025 as of Q3 end.
Disclaimer
The content in this note is for informational purposes only and is not a recommendation to purchase securities or investment advice. Unless otherwise specified, the data in this note is sourced from Bloomberg. We do not represent that the information in this note is correct, complete, or accurate. This note reflects the views of Secure Asset Management, LLC on the date it was written and may change without notice. CPI refers to the “Consumer Price Index,” YoY refers to “Year over Year,” TTM refers to “Trailing Twelve Month.” Unless otherwise stated, performance numbers are total return and assume dividend reinvestment. Unless otherwise stated, Q4 is the period starting 09/30/2024 and ending 12/31/2024, Q1 and YTD refer to the period starting 12/31/2024 ending 03/31/2025. Unless otherwise specified, yield changes in US treasuries are derived from Bloomberg’s Mid YTM closes in the Graph Curves function, and forward rates are calculated using Bloomberg’s Forward Curve Analysis function. Indices are unmanaged and cannot be directly invested into and past performance is not indicative of future results.
At Secure Financial Group, we understand that building a successful financial practice requires not only expertise but also a solid foundation of security and trust. You see, all of our companies have been created and grown from the advisor’s perspective – we’ve done it. We have in house money managers, Attorney’s, Accountant’s, Lending and Risk Managers.
The Secure Financial Group family of companies was founded in 1997 when Secure Investors Group launched as an insurance firm devoted to bringing superior insurance products to clients. Since then, Secure Financial Group has transformed into a comprehensive financial firm, partnering with financial advisors nationwide. All told, Secure Financial Group with its affiliates, Secure Investors Group, Secure Asset Management and Aurora Securities, advise and/or manage over 4 billion in assets.

Please reach out to our team at 248-414-1590 to set up a conversation to learn more about your business and share information about us and see if it makes sense to continue the conversations in a deeper opportunity. If you prefer, use the calendar link to schedule a 15-minute introduction call.
Schedule 15-minute CallAll written consent on this site is for information purposes only. Opinions expressed herein are solely those of Secure Investors Group and our editorial staff. Material presented is to be from reliable sources; however, advisory services are offered by Secure Asset Management, L.L.C., a Registered Investment Advisor.
Insurance services offered through Secure Investors Group. Advisory services offered through Secure Asset Management, L.L.C., a Registered Investment Advisor. Tax services offered through Secure Tax Services, L.L.C. Mortgage services offered through Secure Mortgage Funding, L.L.C. Securities offered through Aurora Securities, Inc. (ASI) Member: FINRA/SIPC. The aforementioned companies are all affiliated companies and maintain common ownership. They do not offer legal advice or services.
Advisory services are offered through Secure Asset Management, LLC., a registered investment advisor. For more information about Secure Asset Management, please visit at www.Investor.gov/CRS or click here to view the Firm's Form CRS.