
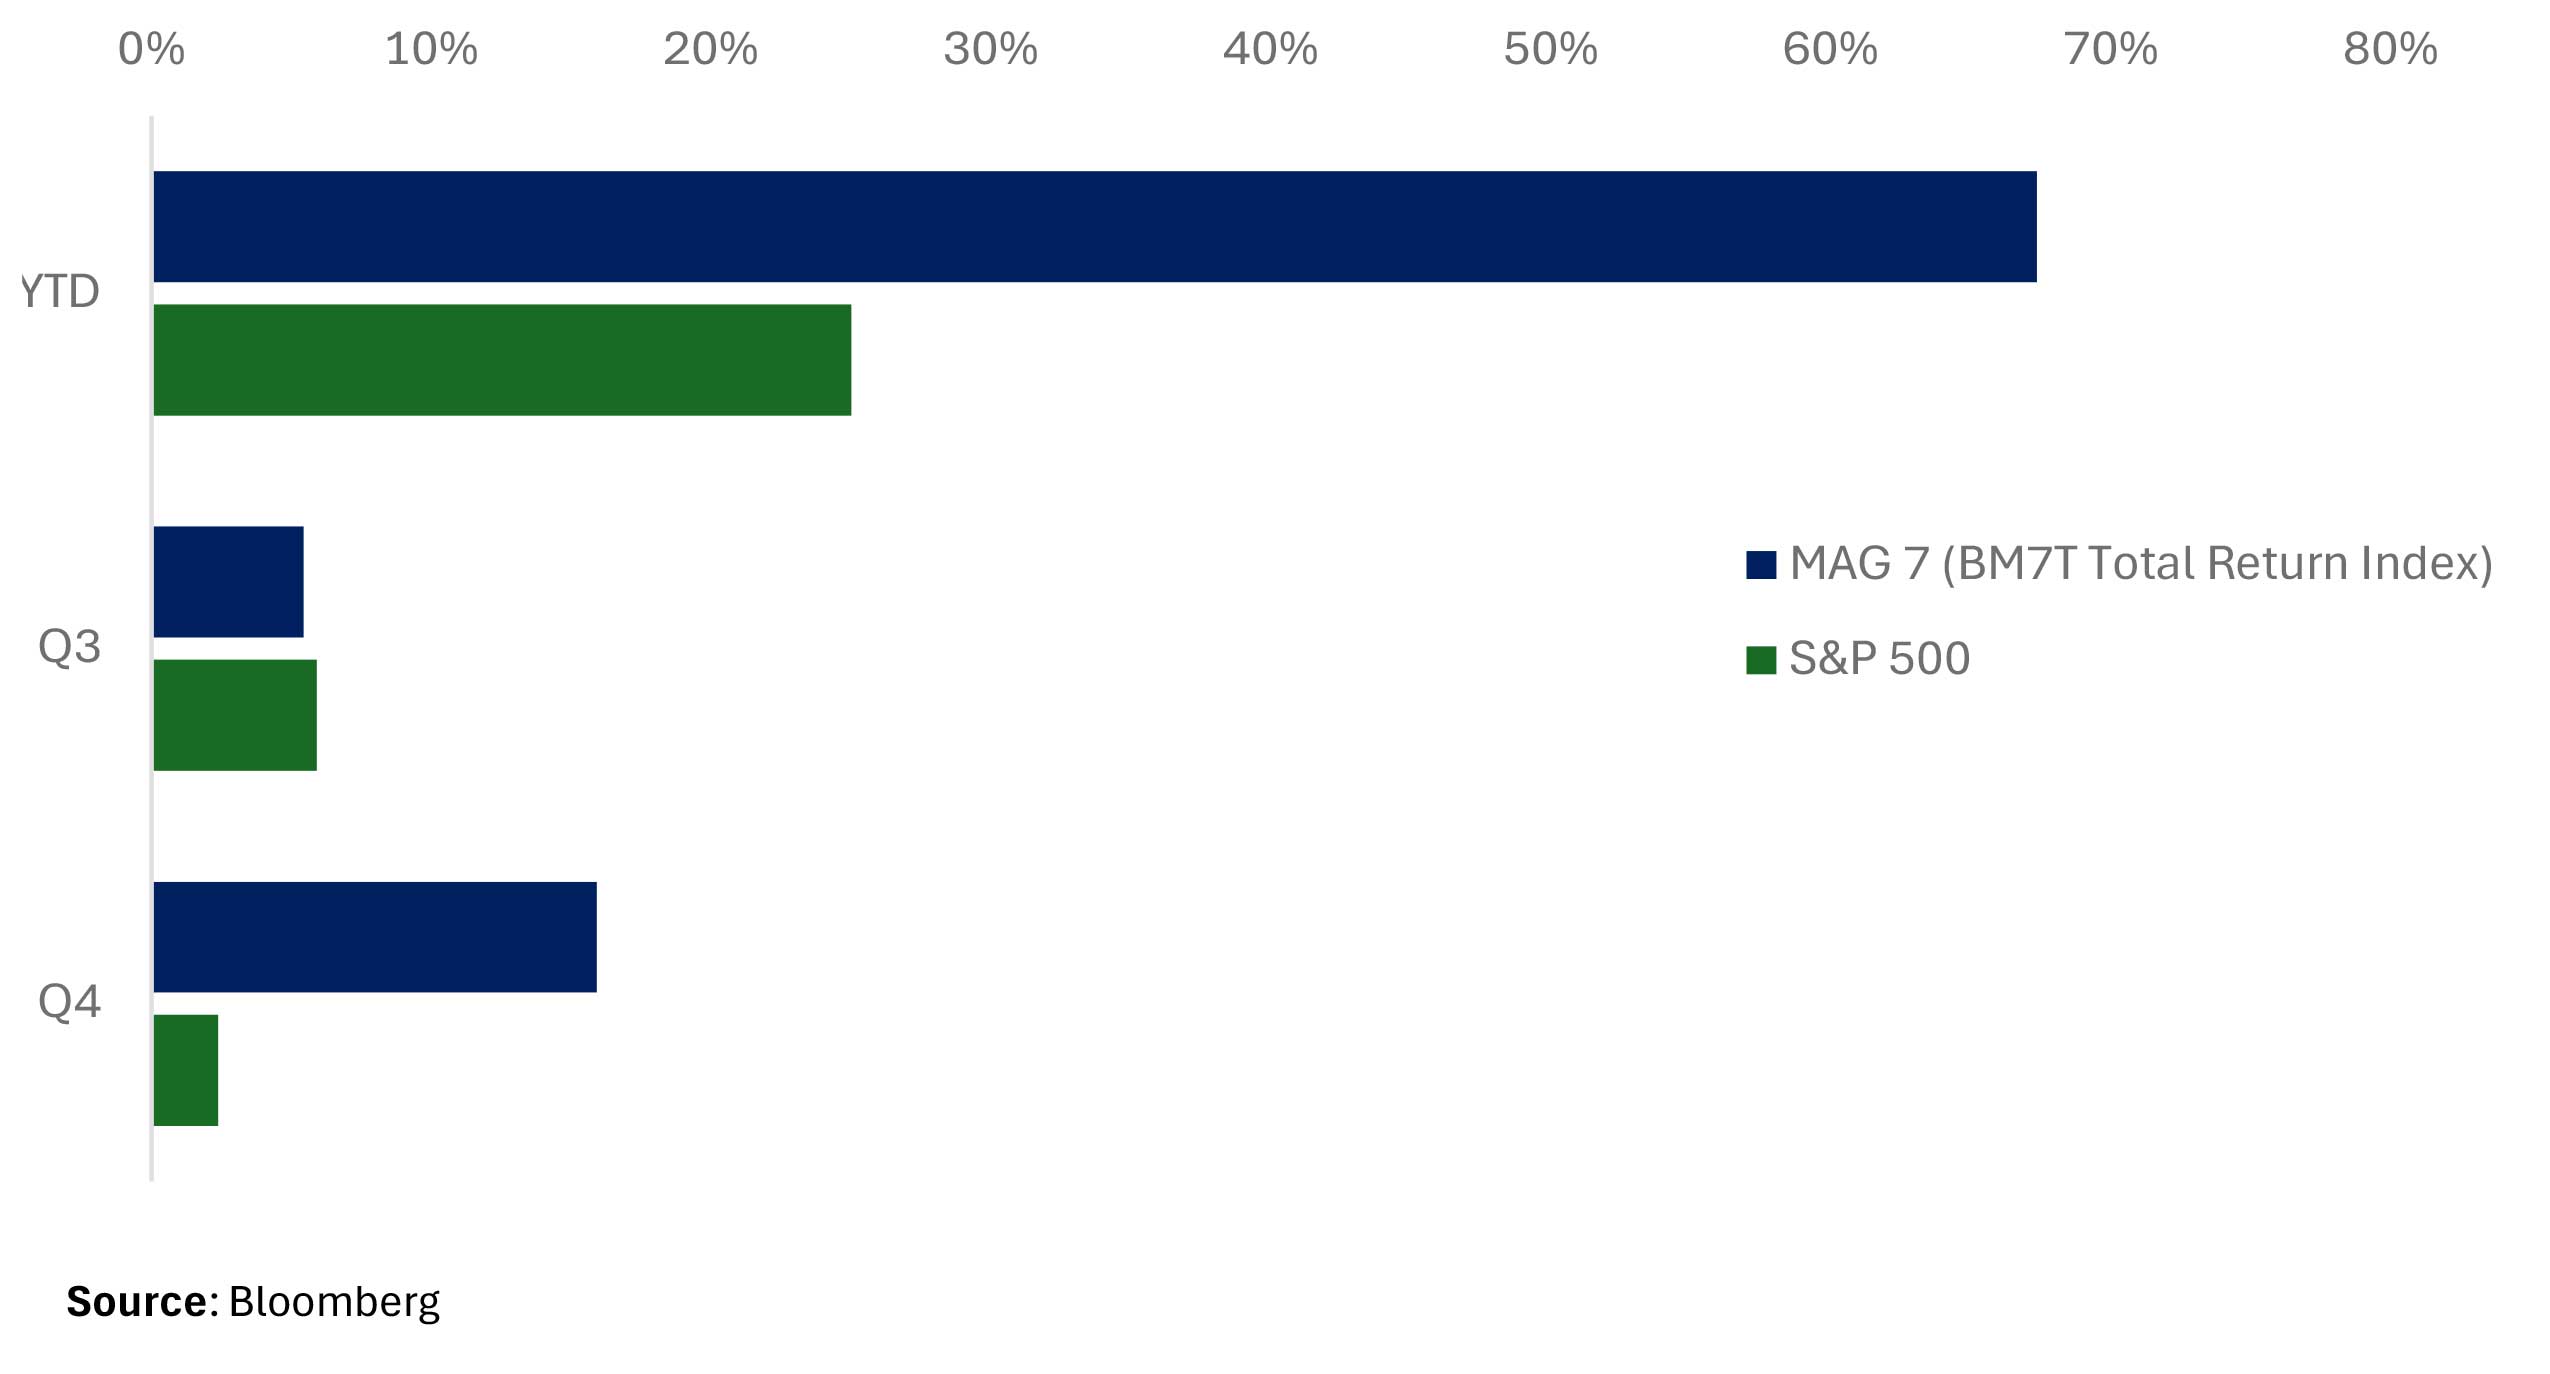
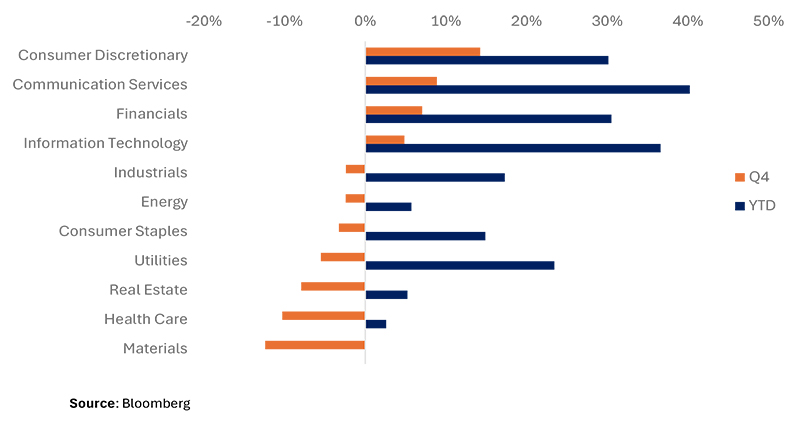
Despite a historic post-election rally and multiple record highs for the S&P 500, the index returned +2.39% in its weakest quarter of 2024, ending the year with a selloff across multiple sectors. Mag 7 stocks (housed in Consumer Discretionary, Communication Services, and Information Technology sectors) and Financials (+7.06% Q4) found strength while other sectors declined, led by Materials (-12.42% Q4) and Healthcare (-10.30% Q4).
Mag 7 stocks leading the index is nothing new for 2024, but it’s a stark contrast to Q3, whose top performer was Utilities (+19.37% Q3).
In part, the outperformance in Financials and Consumer Discretionary (which houses TSLA +54.36% Q4) and underperformance in Energy (-2.44% Q4), Healthcare (-10.30% Q4) and Utilities (-5.51% Q4) can be attributed to a sentiment shift coined as the “Trump Trade.” The shift has been characterized by outperformance in Financials and Crypto (BTC +46.97% Q4) on deregulation hopes, a stronger US Dollar (Bloomberg US Dollar Spot Index +7.10% Q4), rising US Treasury yields (2Y +60bps Q4) on expectations of a tough US trade stance, and underperformance in Healthcare and Energy on Robert F. Kennedy’s appointment to Secretary of the Department of Health and Human Services (HHS) and potential increases in domestic oil supply.
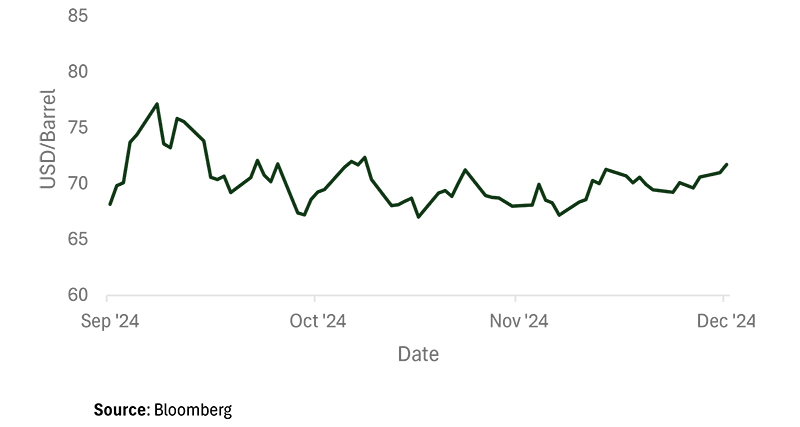
These sectors declined amidst a lack of fundamentals / underlying commodity price movement to justify the moves. Energy declined despite West Texas Intermediate (WTI) Crude futures trading sideways over the quarter (mean price 70.29 σ±2.12). Healthcare sunk despite a constructive earnings backdrop, with 87% of S&P 500 companies in the Healthcare sector beating earnings from October through December. Utilities (71% of which in the S&P 500 beat earnings over the same time period), typically viewed as a defensive play and sensitive to rates declined alongside a sharp sell-off in interest rates over the quarter. Although the Federal Reserve cut rates 50bps in Q4, rates increased on fears of inflationary impacts of trade policies, making fixed income an attractive alternative to defensive stocks and ratcheting up borrowing costs.
Despite outperformance and a constructive earnings backdrop in Tech (87% of S&P 500 companies Technology Sector beat earnings from October through December), geopolitical tension remains a risk to the sector. During Q4, the US and China exchanged blows, with China launching an antitrust probe into NVDA, the Biden administration upholding a law that could ban Tik Tok in the US, and Trump’s tariff rhetoric harshly targeting China.
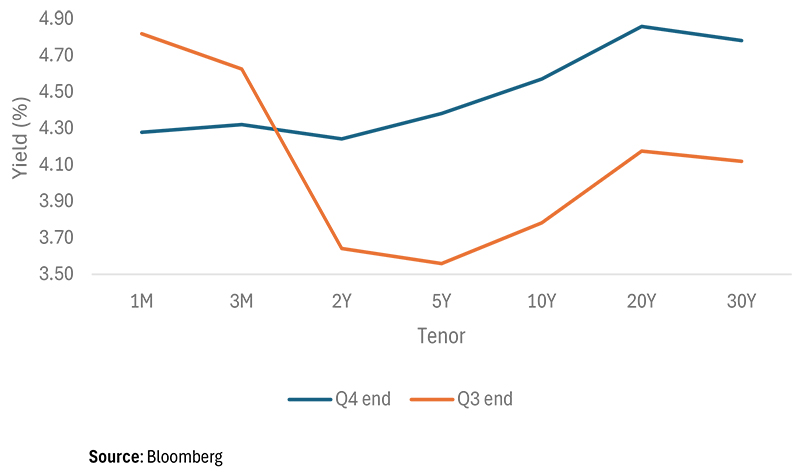
Despite a dovish Fed to start the quarter and 50bps of rate cuts, yields drifted materially higher across the curve (2Y +60bps, 5Y + 82bps, 10Y +79bps), defying forward rate expectations at the end of Q3 (3M forward rates were 2Y -16bps, 5Y -4bps, 10Y ~flat). The data backdrop shifted – with both inflation and the labor market showing resilience in Q4 vs. the weakness that had characterized Q3 and served as a catalyst for the Fed’s 50bp rate cut in September.
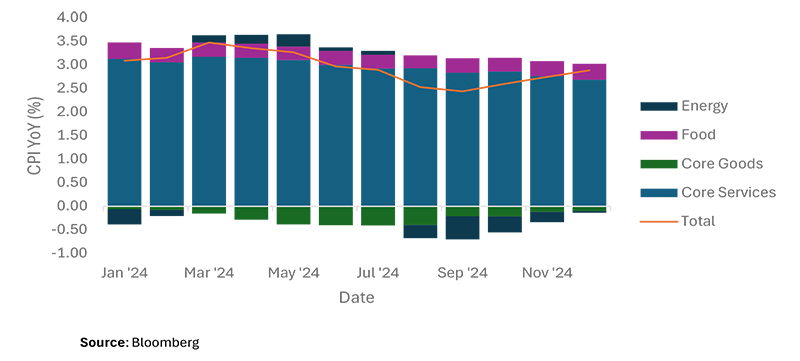
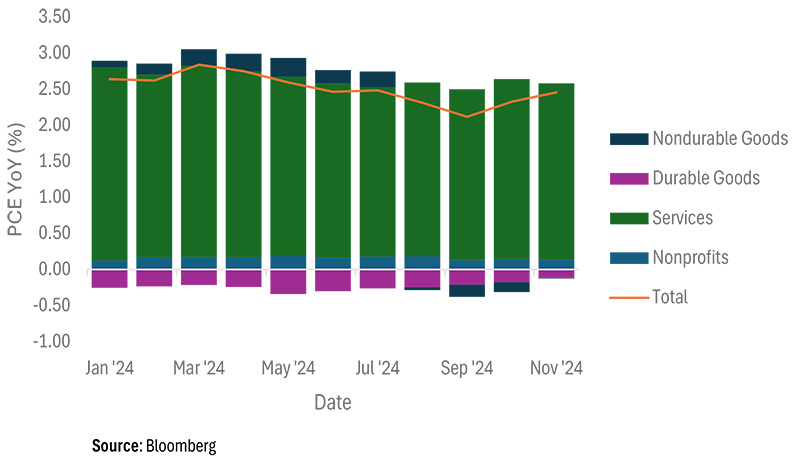
Led by price strength in Services (by both Consumer Price Index or CPI and Personal Consumption Expenditures or PCE measures), inflation was sticky in Q4, with the Year over Year (YoY) headline number trending higher (YoY CPI 2.9%, YoY PCE 2.4%). With the Fed’s preferred measure of inflation being PCE, the 2.4% figure is meaningfully above the 2% target, and up from a 2.1% headline number in September.
Q3 was also characterized by weakening in the labor market, with July / August prints shocking to the downside and revisions of previous months making a meaningful downward impact on the full year employment figure. With the exception of the October print, which the Fed acknowledged was noisy due to natural disasters and strikes, Q4 was a different narrative. The prints from September showed strength in the labor market, shocking to the upside of analyst estimates.
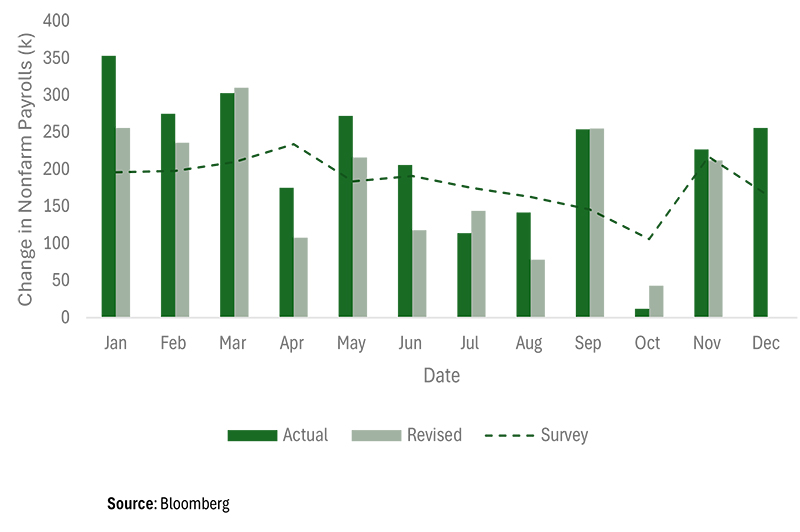
For a data driven Fed, this was enough to lead to a pivot in policy after the 50bps of additional cuts over Q4. At the December meeting, following a 25bp cut, Powell hawkishly signaled a policy recalibration, impressing that the Fed would be “cautious with future cuts.” Equities sold off sharply (SPX -2.95%) that day, making it the S&P 500’s worst Fed day since March 2020. At Q4 end, Fed Funds Futures implied roughly four fewer cuts in 2025 than they did at the start of the quarter.
Disclaimer
The content in this note is for informational purposes only and is not a recommendation to purchase securities or investment advice. Unless otherwise specified, the data in this note is sourced from Bloomberg. We do not represent that the information in this note is correct, complete, or accurate. This note reflects the views of Secure Asset Management, LLC on the date it was written and may change without notice. Unless otherwise stated, performance numbers are total return and assume dividend reinvestment. Unless otherwise stated, Q4 is the period starting 09/30/2024 and ending 12/31/2024, YTD from the period starting 12/29/2023 ending 12/31/2024. “Q4 end” refers to December 31, 2024. Unless otherwise specified, yield changes in US treasuries are derived from Bloomberg’s Mid YTM closes in the Graph Curves function, and forward rates are calculated using Bloomberg’s Forward Curve Analysis function. Past performance is not indicative of future results. Earnings beats breakdowns by sector are done so using the Bloomberg BICS sector classification. Indices mentioned herein are unmanaged and cannot be invested into.
At Secure Financial Group, we understand that building a successful financial practice requires not only expertise but also a solid foundation of security and trust. You see, all of our companies have been created and grown from the advisor’s perspective – we’ve done it. We have in house money managers, Attorney’s, Accountant’s, Lending and Risk Managers.
The Secure Financial Group family of companies was founded in 1997 when Secure Investors Group launched as an insurance firm devoted to bringing superior insurance products to clients. Since then, Secure Financial Group has transformed into a comprehensive financial firm, partnering with financial advisors nationwide. All told, Secure Financial Group with its affiliates, Secure Investors Group, Secure Asset Management and Aurora Securities, advise and/or manage over 4 billion in assets.

Please reach out to our team at 248-414-1590 to set up a conversation to learn more about your business and share information about us and see if it makes sense to continue the conversations in a deeper opportunity. If you prefer, use the calendar link to schedule a 15-minute introduction call.
Schedule 15-minute CallAll written consent on this site is for information purposes only. Opinions expressed herein are solely those of Secure Investors Group and our editorial staff. Material presented is to be from reliable sources; however, advisory services are offered by Secure Asset Management, L.L.C., a Registered Investment Advisor.
Insurance services offered through Secure Investors Group. Advisory services offered through Secure Asset Management, L.L.C., a Registered Investment Advisor. Tax services offered through Secure Tax Services, L.L.C. Mortgage services offered through Secure Mortgage Funding, L.L.C. Securities offered through Aurora Securities, Inc. (ASI) Member: FINRA/SIPC. The aforementioned companies are all affiliated companies and maintain common ownership. They do not offer legal advice or services.
Advisory services are offered through Secure Asset Management, LLC., a registered investment advisor. For more information about Secure Asset Management, please visit at www.Investor.gov/CRS or click here to view the Firm's Form CRS.